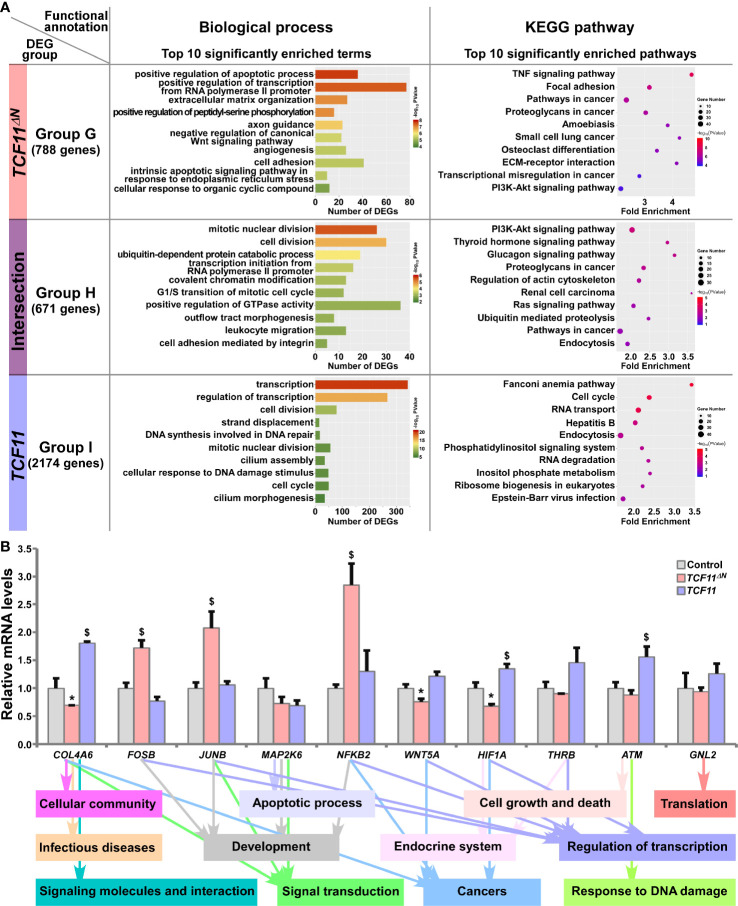
Figure 5.
Functional annotation of specific or common DEGs in TCF11ΔN and TCF11 cells. (A) Top 10 of significant biological process terms and pathways enriched by DEGs in Groups G, H, and I were exhibited in histograms and scatterplots, respectively. (B) After induced with 1 μg/ml Tet for 12 h, total RNAs were isolated from Control, TCF11ΔN or TCF11 cell lines before being reversely transcribed into the first strand of cDNA. Subsequently, relative mRNA levels of DEGs that were associated with more functions, along with high expression levels and well significance in Groups G to I, were determined by quantitative real-time PCR in Control, TCF11ΔN and TCF11 cells. The data are shown as mean ± SEM (n = 3 × 3, *p < 0.05; $ p < 0.05, when compared to the Control values).

