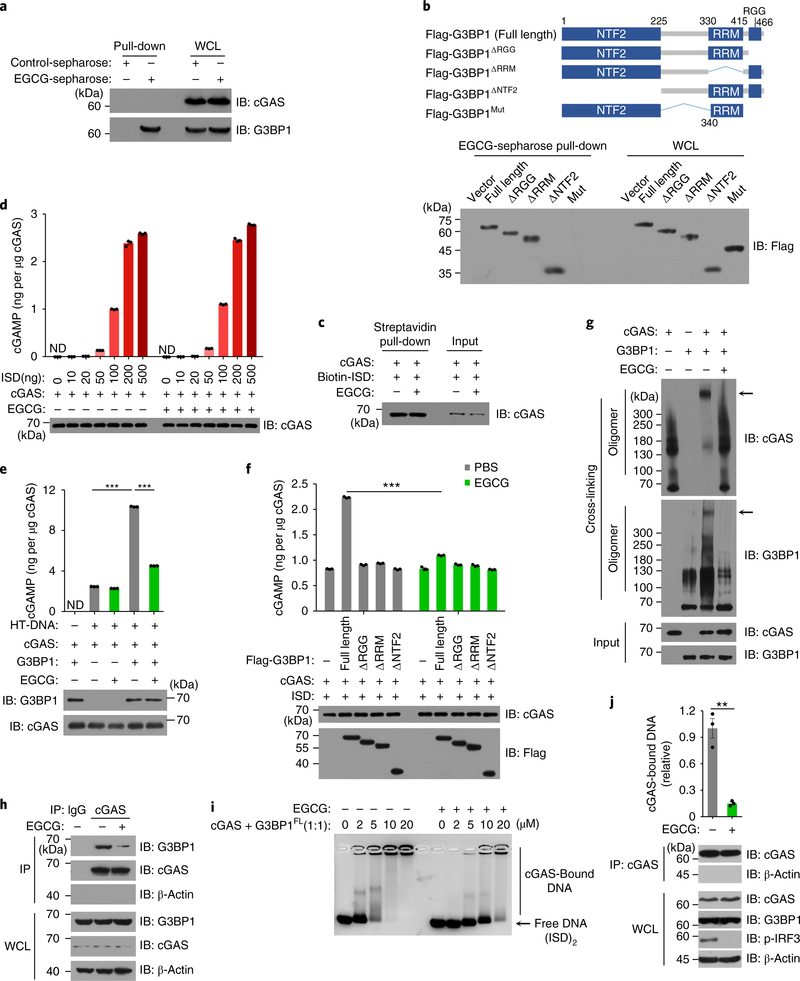
Fig. 5 |. EGCG inhibits G3BP1-promoted cGAS activation.
a, The EGCG–G3BP1 binding was analyzed by EGCG-conjugated Sepharose pull-down in U937 cells. b, Schematic drawing of full-length G3BP1 and G3BP1 mutants (top). EGCG–G3BP1 binding was analyzed by EGCG-conjugated Sepharose pull-down in G3BP1−/− HEK293T cells expressing indicated flag-tagged G3BP1 variants (bottom). c, The in vitro cGAS–DNA binding in the presence or absence of EGCG was analyzed by biotin–ISD pull-down. d, The cGAS alone-mediated cGAMP production, in the presence or absence of EGCG, was analyzed by LC–MS/MRM. e,f, Recombinant cGAS and G3BP1FL or G3BP1 mutants were incubated with ISD in the presence or absence of EGCG (20 μM). The production of cGAMP was analyzed by LC–MS/MRM. g, Recombinant cGAS and G3BP1FL were incubated with cross-linker in the presence or absence of EGCG and analyzed with immunoblotting. h, The cGAS-G3BP1 interaction was analyzed by immunoprecipitation in U937 cells left untreated or treated with EGCG. i, EMSA shows the effect of EGCG on cGAS–DNA binding in the presence of G3BP1, grayscale-inverted image is shown. j, The effect of EGCG on cGAS–DNA binding in U937 cells was analyzed as described in Fig. 4b. β-Actin, loading control. β-Actin blots in IP samples indicate the purity of IP (h,j). PBS was used as control for EGCG. **P < 0.01, ***P < 0.001, two-tailed t-test (e,f,j). Data are representative of three experiments, mean ± s.e.m. of triplicate samples in d–f,j.

