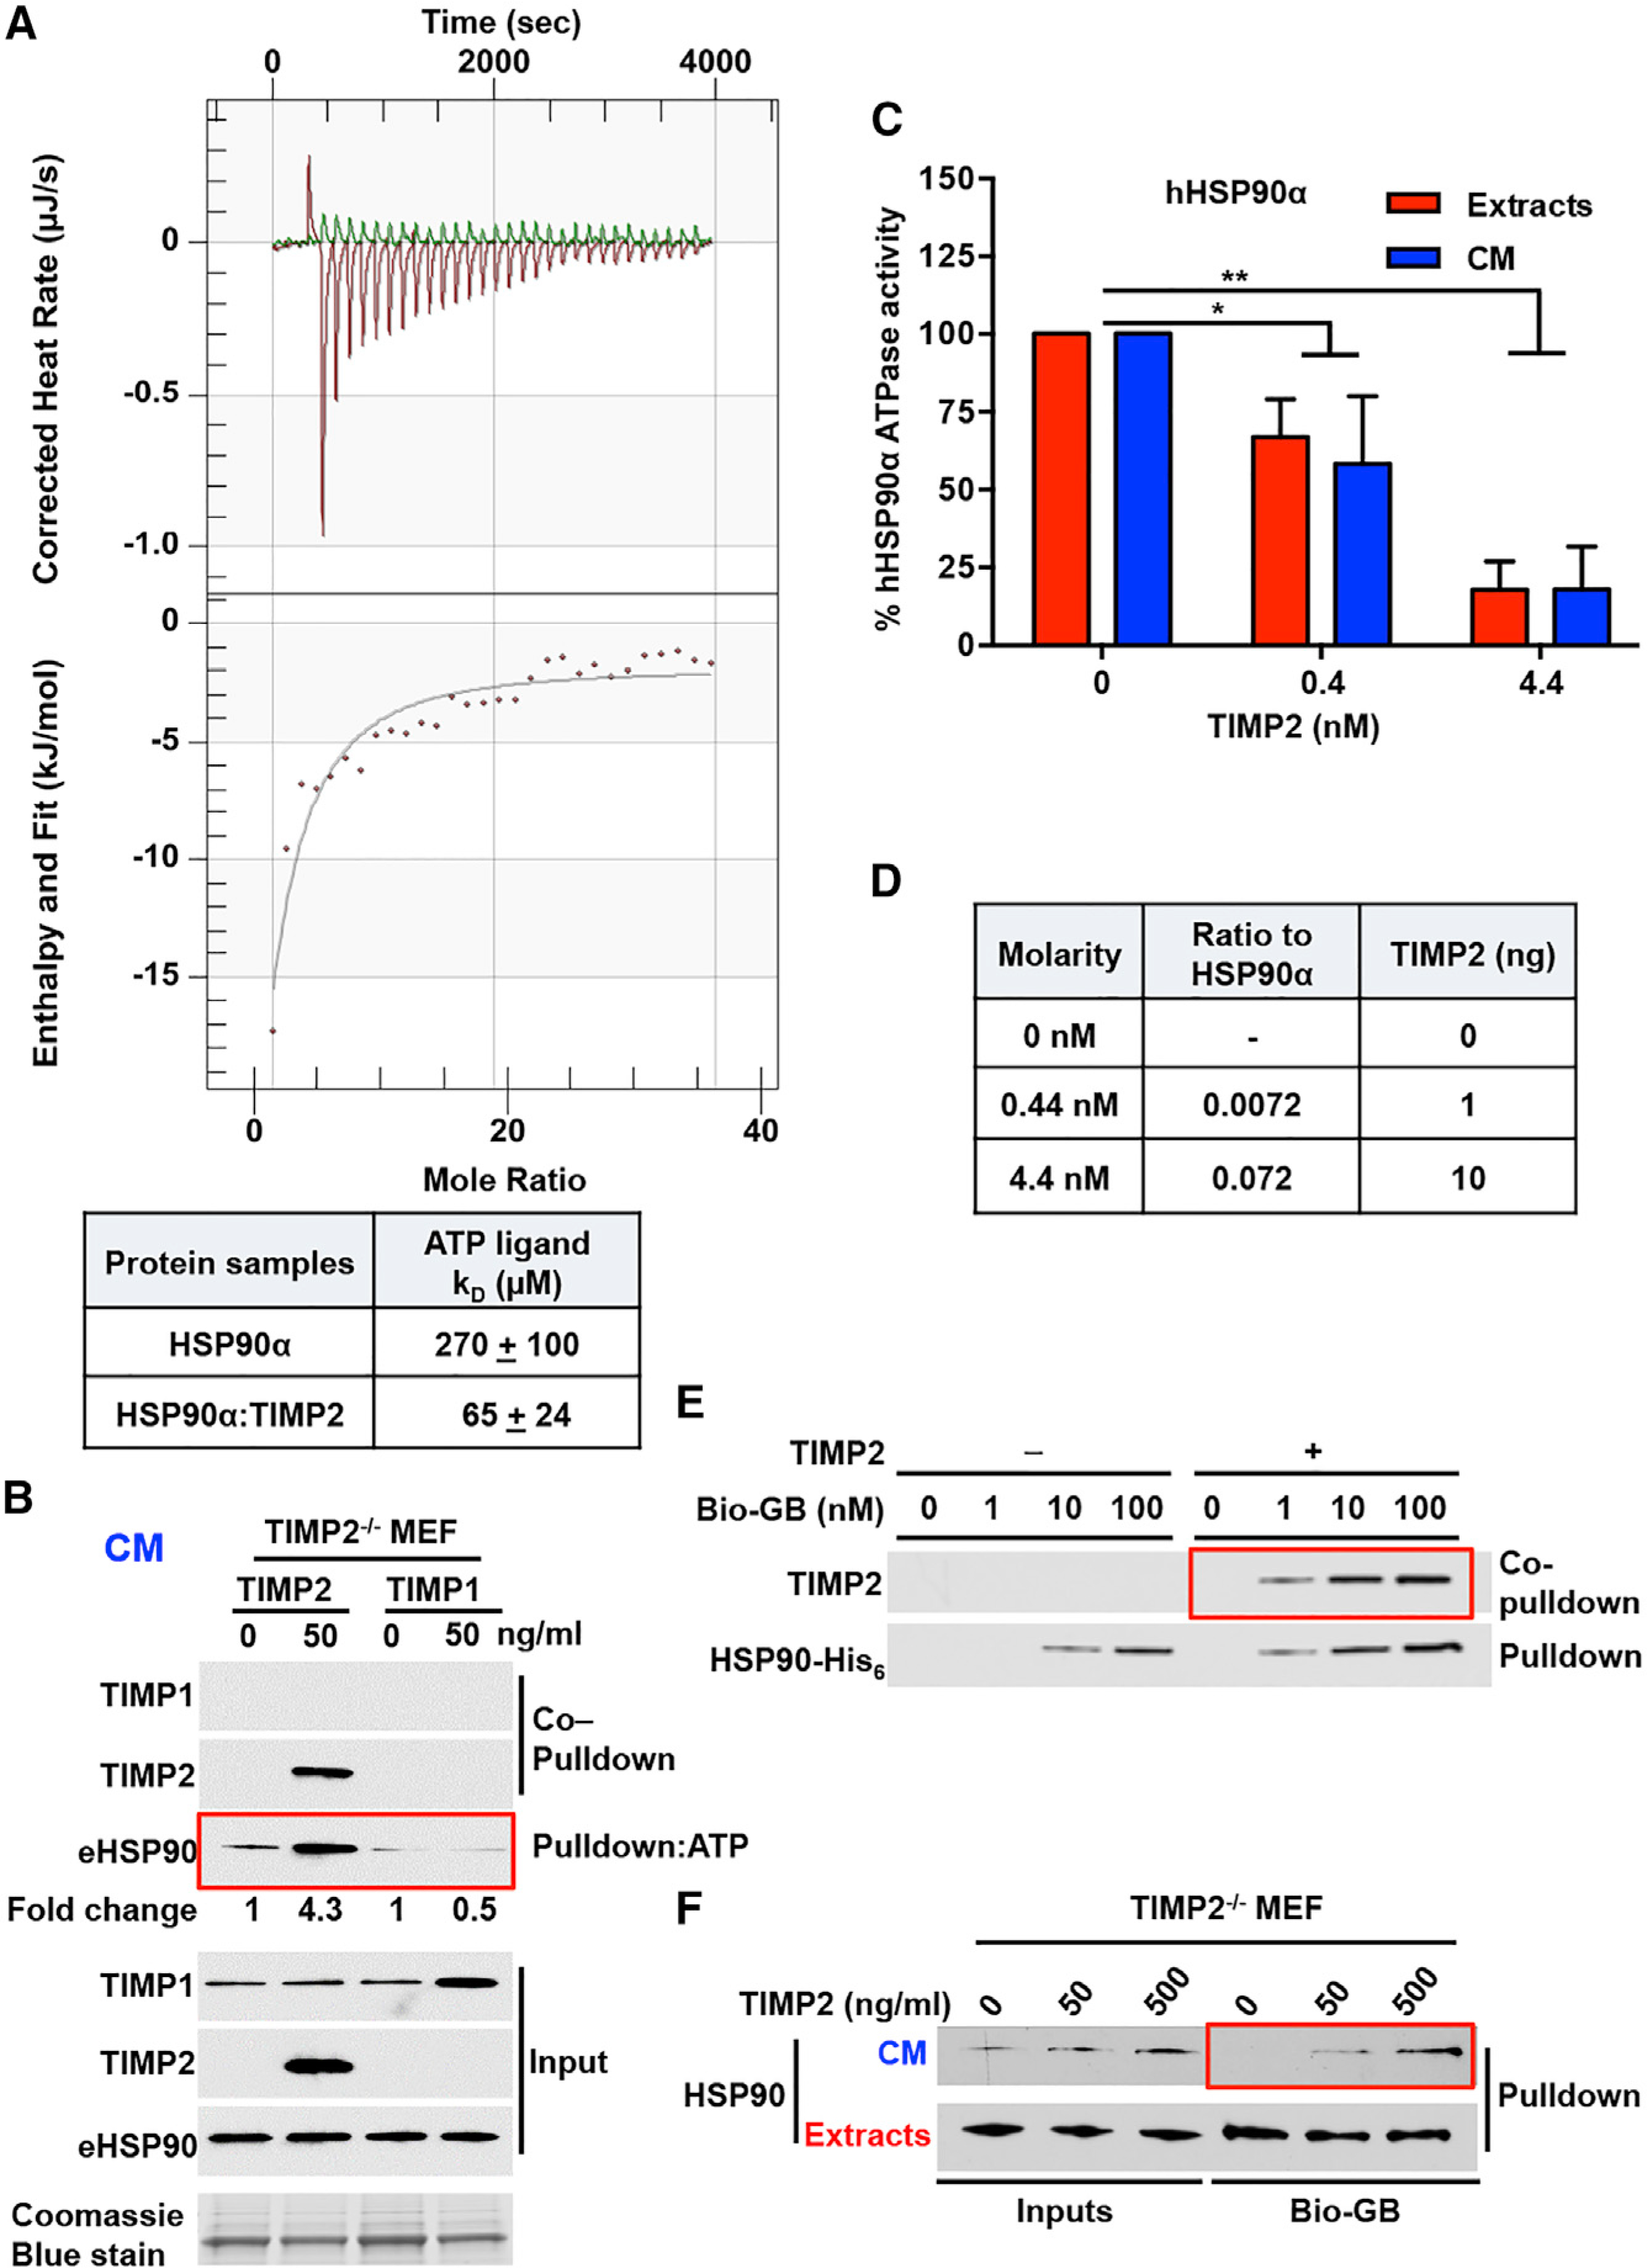
Figure 3. TIMP2 Co-chaperone Inhibits HSP90 ATPase Activity and Increases HSP90 Binding to Both ATP and Drugs.

(A) ITC of HSP90-His6:TIMP2-His6 binding to ATP. Corrected heat rate (μJ/s) and enthalpy/fit (kJ/mol) are presented at the top and bottom, respectively. The dissociation constant (KD) is shown in the table for the HSP90-His6:TIMP2-His6 complex and HSP90-His6 alone. Errors represent the SEM of n = 2 independent experiments.
(B) ATP-beads were incubated with TIMP2−/− MEF CM for eHSP90 ATP-pull-down. Co-pull-down of TIMP2 and TIMP1 was performed following addition of each protein. Fold change was determined using ImageJ. Coomassie blue stain was used as a loading control for CM.
(C) ATPase activity of HSP90α purified from HEK293 cell extracts and CM was measured in the absence and presence of different amounts of TIMP2 (nM). Activity (%) was normalized relative to the untreated HSP90. Error bars indicate SEM from n = 3 independent experiments.
(D) Molarity of the proteins in the ATPase assay (Figure 3C), ratio to HSP90α, and total quantity of TIMP2 protein added (ng).
(E) HSP90-bound to the drug was pulled down with streptavidin agarose, and TIMP2 was co-pulled down. Recombinant HSP90α -His6 (100 ng) was incubated with recombinant TIMP2 (10 ng), followed by the addition of different amounts of Bio-GB (1 ng, 10 ng, or 100 ng).
(F) Cell extracts and CM were collected from TIMP2−/− MEFs following the addition of TIMP2 (50 and 500 ng/mL) and incubated with 100 nM of Bio-GB and addition to streptavidin agarose for pull-down experiments.
Significance: *p < 0.05; **p < 0.01; ***p < 0.001; ****p < 0.0001. See also Figure S3.
