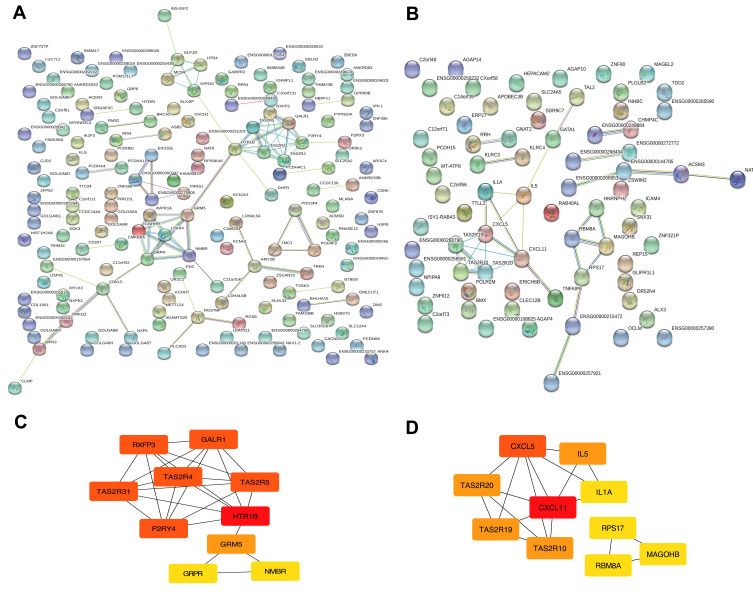
Figure 3.
Module visualisation and Identification of hub genes. Visualisation of the gene co-expression network of the blue (A) and yellow modules (B) were generated using Cytoscape. Top 10 hub genes in blue (C) and yellow (D) modules were calculated by cytoHubba ranked by degree. The darkness of red in nodes represents the depth of degree.

