Figure 1.
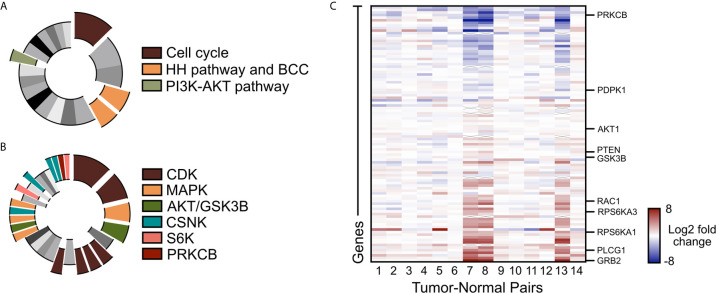
PI3K/AKT pathway is upregulated in advanced BCC tumors. (A) KEGG analysis of the upregulated genes in advance BCC tumors highlighting the significant indicated terms. Cell cycle, p = 3.10 x 10⁻⁸; BCC, p = 1.03 x 10⁻⁴; HH signaling pathway, p = 2.49 x 10⁻⁴; PI3K-AKT signaling pathway, p = 0.00675. (B) Kinase Enrichment Analysis of differentially expressed genes showing significant kinases as indicated. In descending significance to color codes: CDK2, p = 4.80 x 10⁻¹²; CDK1, p = 1.13 x 10⁻⁸; MAPK14, p = 2.59 x 10⁻⁶; GSK3B, p = 5.42 x 10⁻⁶; CDK15, p = 3.88 x 10⁻⁴; CDK14, p = 4.39 x 10⁻⁴; CDK18, p = 4.94 x 10⁻⁴; CDK11A, p = 6.23 x 10⁻⁴; MAPK1, p = 0.00460; AKT1, p = 0.00534; MAP3K10, p = 0.00641; CSNK2A1, p = 0.00796; MAPK9, p = 0.00828; RPS6KA5, p = 0.0123; CSNK2A2, p = 0.0165; CSNK1E, p = 0.0268; CSNK1D, p = 0.0275; PRKCB, p = 0.0281; RPS6KA1, p = 0.0332. (C) Heat map of the differentially expressed PI3K pathway genes in advanced human BCCs compared to patient-matched normal skin. X mark, absence of data.

