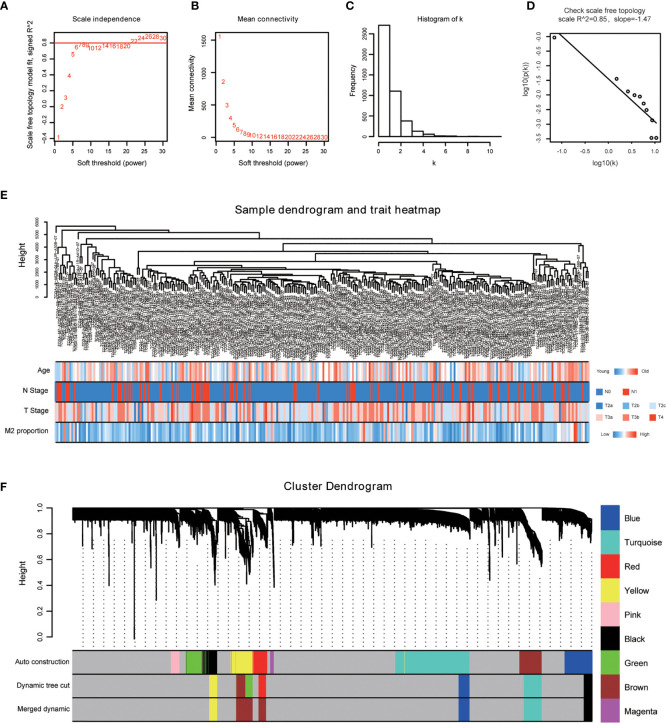
Figure 3.
WGCNA was performed based on PCa samples from TCGA database. (A) Analysis of the scale-free fit index for various soft-thresholding powers; (B) Analysis of the mean connectivity for various soft-thresholding powers; (C) Histogram of connectivity distribution when β = 22; (D) Checking the scale free topology when β = 22; (E) The sample dendrogram and corresponding clinical characteristics; red: high, blue: low. (F) Cluster dendrogram of 292 samples with eligible data.

