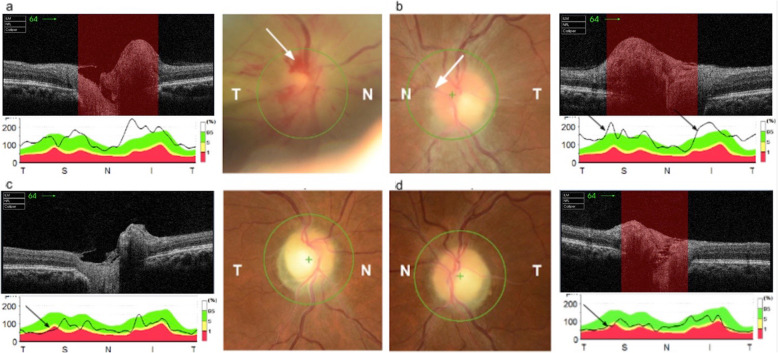
Fig. 3.
OCT disc imaging. a OCT disc of the right eye at the time of diagnosis showing flame haemorrhages (black arrow) and disc swelling evidenced by blurring of the disc margins. Disc swelling is also evident on the OCT cross section of the disc (white arrow). b OCT disc of the left eye at the time of diagnosis showing disc swelling evidenced by blurring of the disc margins (black arrow) and thickening of the retinal nerve fibre layer (black arrow). c OCT disc of the right eye 2 months after initial diagnosis, showing disc pallor when compared to previous OCT of the right eye and atrophy of the retinal nerve fibre layer as depicted by the RNFL graph (black arrow). d OCT disc of the left eye 2 months after initial diagnosis, showing disc pallor when compared to previous OCT of the left eye and atrophy of the retinal nerve fibre layer as depicted by the RNFL graph (black arrow)

