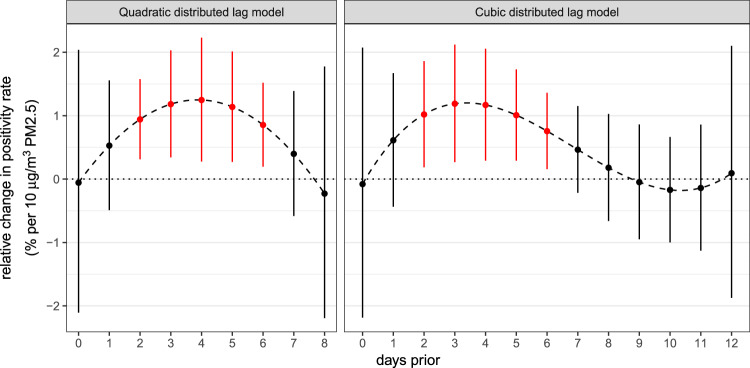
Fig. 4. The relative percent change in the SARS-CoV-2 positivity rate associated with an increase of 10 μg/m3 in daily mean PM2.5 at each lag, where separate lag effects are considered within the same model and the effects are constrained to follow a quadratic function over lags 0–8 (left panel) and a cubic function over lags 0–12 (right panel).
Error bars indicate 95% confidence intervals, which were not corrected for multiple testing.

