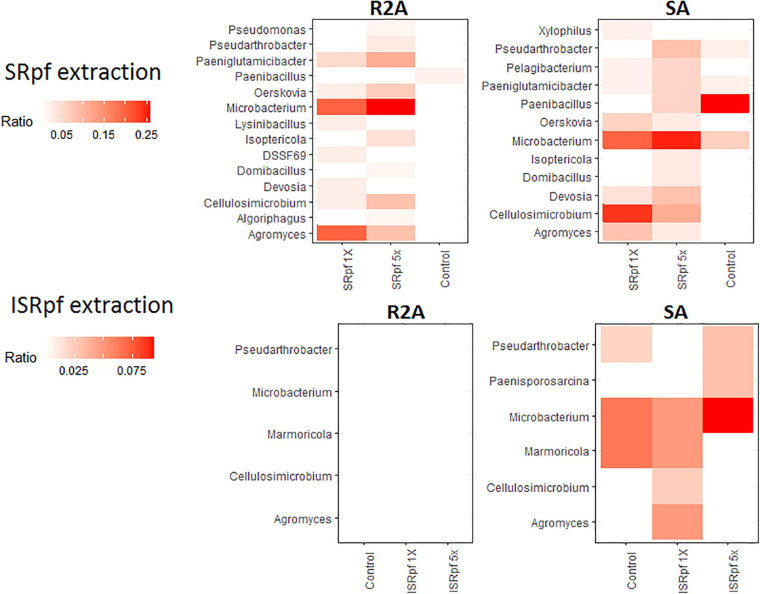
FIGURE 7.
Dominance of each differentially abundant genus from ASV data (Figure 2) on SA or R2A plates, for different extraction strategies (SRpf, upper panels and ISRpf, lower panels). A higher color intensity represents a higher abundance of that genus growing on a specific solid medium. Ratios represent the number of isolates of a particular genus retrieved from a particular condition, divided by all the isolates retrieved from that same specific condition (e.g., from 5× SRpf-treated soils plated on R2A, i.e., the upper left panel, the second column, Microbacterium comprised 25% of all the retrieved isolates). Only the genera for which a differential abundance was detected in the ASV data are considered in this figure.

