FIGURE 4.

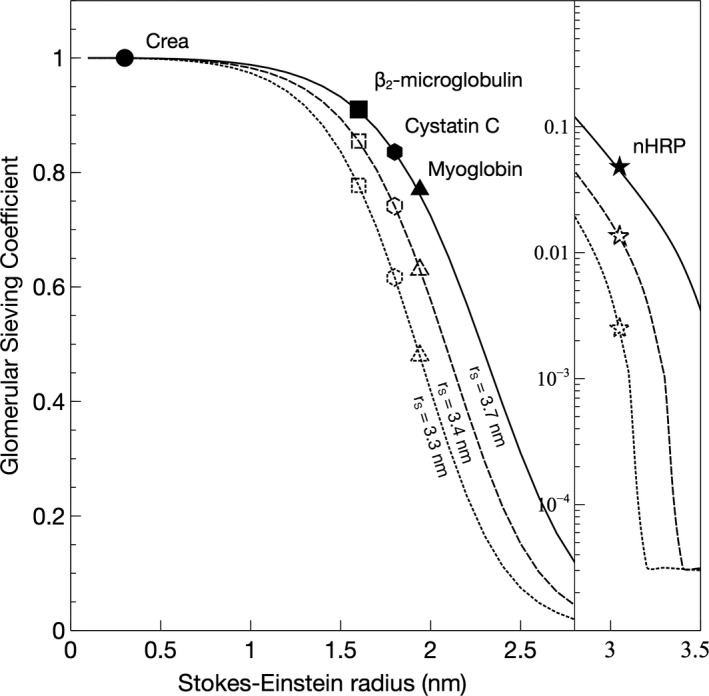
Glomerular sieving coefficients versus Stokes–Einstein radius for scenarios with shrunken pores, 3.4 nm (dashed line), and 3.2 nm (dotted line) compared to normal (3.7 nm; solid line)

Glomerular sieving coefficients versus Stokes–Einstein radius for scenarios with shrunken pores, 3.4 nm (dashed line), and 3.2 nm (dotted line) compared to normal (3.7 nm; solid line)