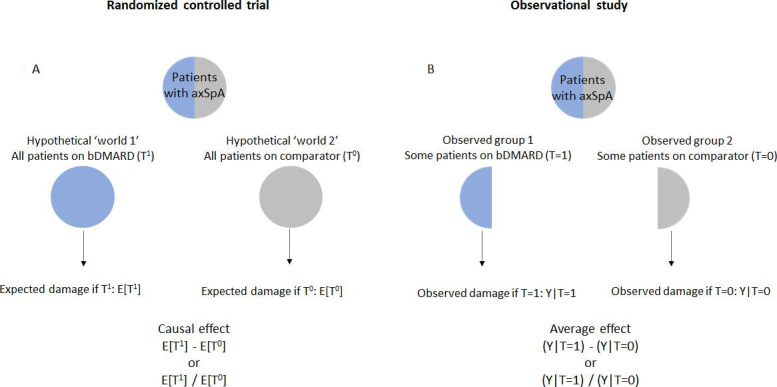
Figure 1.

Causal effect versus association. Inspired by a figure from the following book: Hernán MA, Robins JM (2020). Causal inference: what if. Boca Raton: Chapman & Hall/CRC.50 The notation below each figure indicates either a mean difference or a risk ratio as measures of the treatment effect. For instance, in an observational study, we determine the difference between the mean value of mSASSS among patients on bDMARDs (Y|T=1) and the mean value of mSASSS among the controls (Y|T=0). We might also determine the risk of developing a new syndesmophyte among those on bDMARD (Y|T=1), relative (divided) to the risk of a new syndesmophyte in controls (Y|T=0). Unlike randomised controlled trials, the treatment effect is biased because each group is not representative of the entire source population and groups are therefore not exchangeable. axSpA, axial spondyloarthritis; bDMARD, biological disease-modifying antirheumatic drug; mSASSS; modified Stoke Ankylosing Spondylitis Spinal Score.
