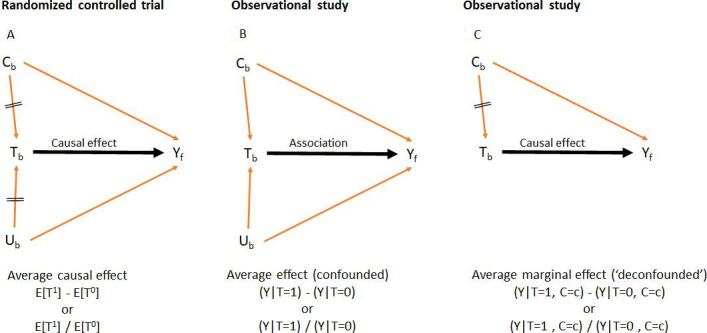
Figure 2.

Directed acyclic graphs (DAGs) representing (A) a causal effect in a randomised controlled trial, (B) an association in an observational study and (2C) an average marginal effect in an observational study. Black arrow, association of interest (‘front door’); red arrows, biasing paths (‘back doors’); crossed red arrows, closed biasing paths (eg, by randomisation in A and adjustment in C). Tb, treatment status at baseline (yes/no); Cb, a set of observed pretreatment confounders at baseline; Ub, a set of unobserved pretreatment confounders at baseline; Yf, outcome at follow-up. The notation below each DAG indicates either a mean difference or a risk ratio as measures of the treatment effect. The average marginal effect is the equivalent of a causal effect of a randomised controlled trial under the assumption that all confounders had been measured and adjusted for (no unmeasured confounding).
