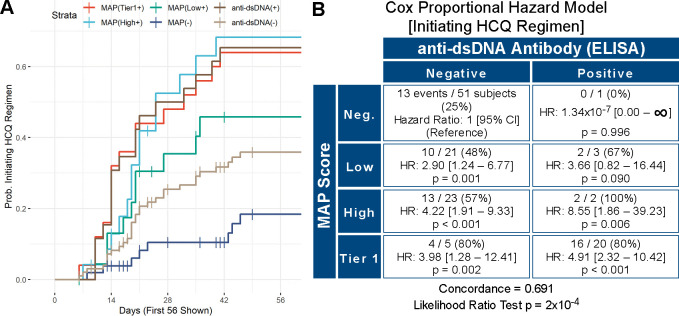
Figure 4.
Survival analysis (hydroxychloroquine (HCQ)). (Panel A) Kaplan-Meier time-to-event curves for use of HCQ over time. Curves show the per cent probability of using HCQ after T0 for the four study groups (tier-1 (multianalyte assay panel (MAP)(Tier1+)], high tier-2 (MAP(High+)), low tier-2 (MAP(Low+)), MAP negative (MAP(−)), together with anti-double-stranded DNA positive (anti-dsDNA(+)) and negative (anti-dsDNA(−)) patients throughout the study. TThe x-axis reports the number of days since T0 and is truncated at 56 days to allow better visualisation of the initial portion of the survival curves. (Panel B) Cox proportional hazard model comparing the MAP score (Neg.: negative; Low: low tier-2; High: high tier-2, Tier 1: tier-1 positive) versus anti-dsDNA antibodies for use of HCQ. In each quadrant, the numerators represent the number of subjects on HCQ after T0 (events, n=60 in total) while the denominators represent all subjects in that quadrant. Concordance and p value of the likelihood ratio test are also reported. For data analysis, we used the date of the visit when HCQ use was recorded in the medication list.

