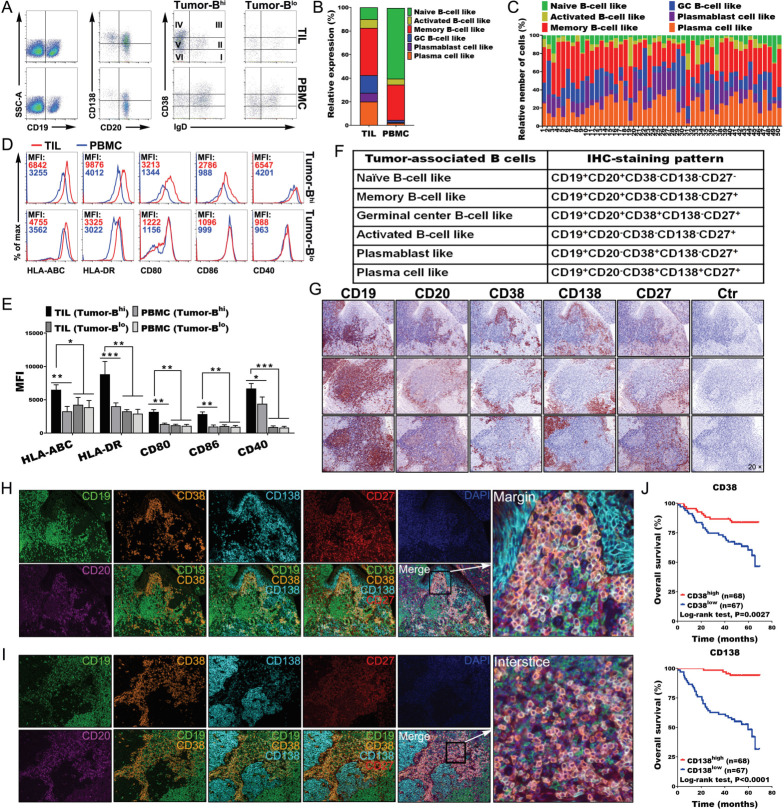
Figure 5.
Migration and infiltration of tumor-associated B cells in the TLSs. (A, B) Representative dot plots and statistical analysis showing the indicated markers and phenotypic characteristics of CD19+ B cells, including the percentage of naïve B cells (CD19+CD20+-IgD+CD38−CD138−), activated B cells (CD19+CD20−IgD−CD38−CD138−), memory B cells (CD19+CD20+IgD−CD38−CD138−), GC-B cells (CD19+CD20+IgD−CD38+ CD138−), plasmablast-like cells (CD19+CD20−IgD-CD38+CD138−) and plasma cells (CD19+CD20−IgD−CD38+CD138+) in TILs and PBMCs (n = 50). (C) Relative frequency of different B-cell subsets among all CD19+ B cells (n=50). (D, E) Representative dot plots and statistical analysis showing the expression of the indicated markers by tumor-derived Bhigh and blow cells (n=6), respectively. (F) Marker combinations used to identify tumor-associated B-cell subpopulations by six-color IHC staining. (G) IHC staining of three representative tumor sections from different patients showing the indicated markers at different levels. (H, I) Full composite image together with DAPI counterstaining and images for each of the individual markers and different combinations from the composite image at the interstice or margin. (J) Survival analysis of the cohort stratified by CD38+ plasmablasts and CD138+ plasma cells identified by IHC staining, which the threshold used to define high and low is 6 and 9, respectively. Data were expressed as means±SD, and paired two-tailed Student t test. *P<0.05, **P<0.001, ***P<0.0001. IHC, immunohistochemistry; PBMC, peripheral blood mononuclear cell; TIL, tumor-infiltrating lymphocyte.

