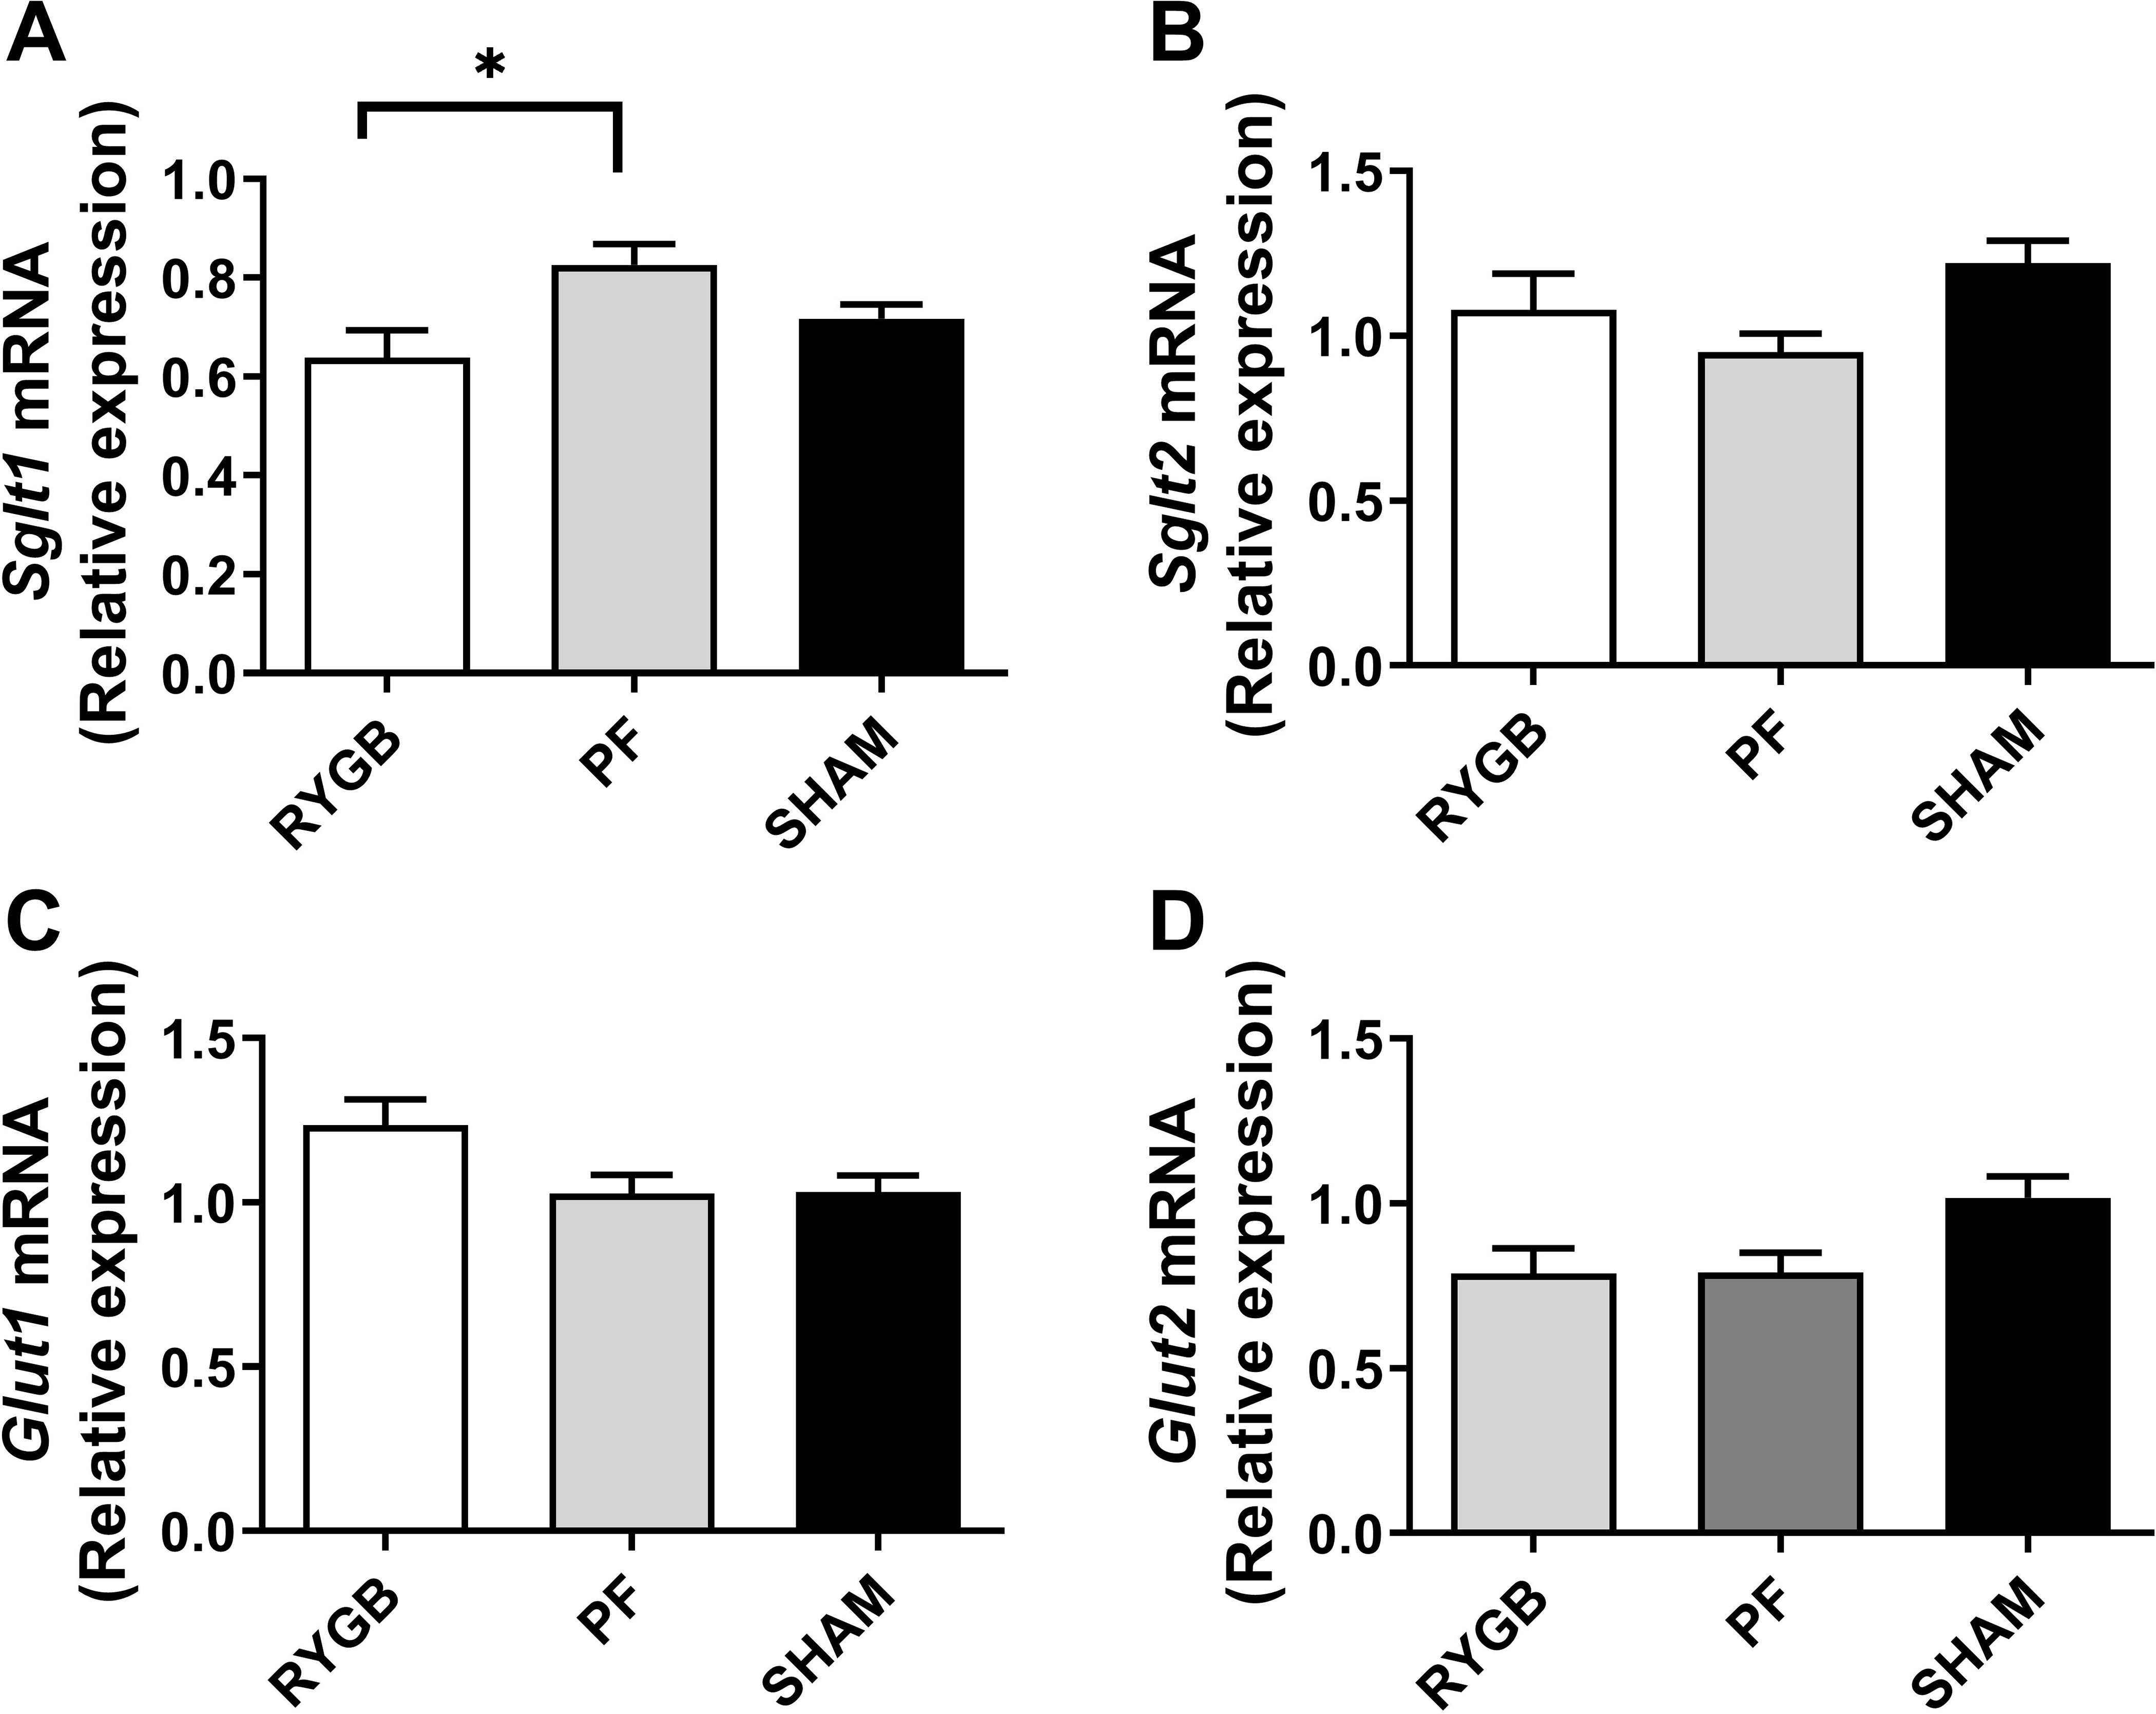
Figure 3.

Kidney glucose transporters mRNA expression 30 days after randomization in RYGB (white bars), SHAM (black bars) and pair-fed (PF, grey bars) rats (n = 13–15 per group). Sodium-glucose cotransporter 1 (Sglt1, A) and 2 (Sglt2, B) and Glucose transporter 1 (Glut1, C) and 2 (Glut2, D). Data are presented as mean±SEM. * denotes P≤0.05 ANOVA with Tukey post-test.
