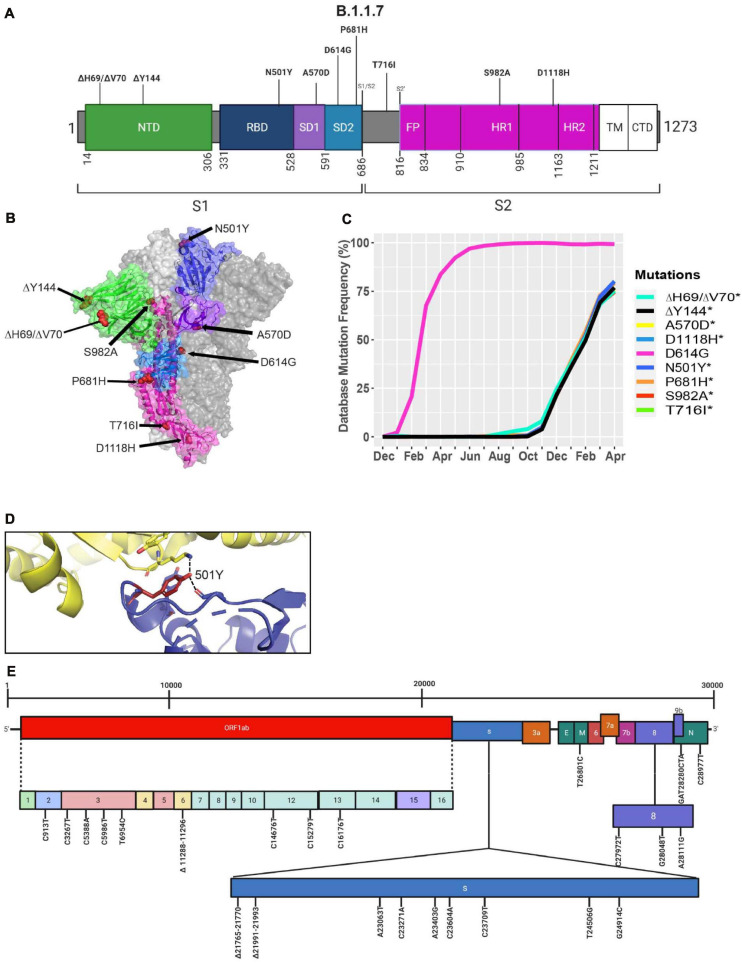
FIGURE 5.
Analysis of mutations in the B.1.1.7 variant. (A) Mutation map of the spike protein of B.1.1.7. (B) Structural representation of spike with ACE2. B.1.1.7 S protein mutations are presented in red. N-terminal domain (NTD) (green), receptor-binding domain (RBD) (blue), SD1 (purple), subdomain 2 (SD2) (light blue), and S2 (magenta) are illustrated. The other S protein monomers are displayed in gray and white. (C) Frequency of the mutations in the S protein, B.1.1.7 variant from December 2019 to April 30, 2021. (D) Interaction of the N501Y (red) mutation in the RBD (blue) of S protein with hACE2 (yellow). The dash lines indicate interactions with adjacent residues. (E) Genome of the SARS-CoV-2 B.1.1.7 variant with identified nucleotide substitutions and deletions. Graphs were generated using Biorender, PyMOL, and RStudio. *Overlapping curves.

