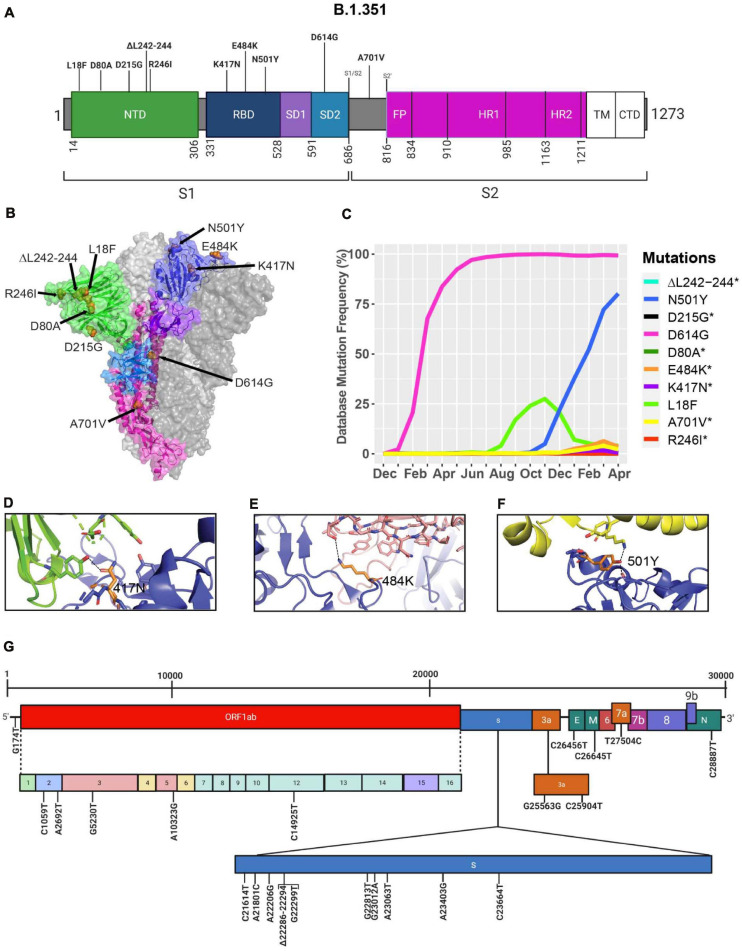
FIGURE 7.
Analysis of mutations in the B.1.351 variant. (A) Mutation map of the spike protein of B.1.351. (B) Structural representation of spike with ACE2. B.1.352 S protein mutations are presented in orange. NTD (green), RBD (blue), SD1 (purple), SD2 (light blue), and S2 (magenta) are illustrated. The other S protein monomers are illustrated in gray and white. (C) Frequency of the mutations in the S protein B.1.351 variant from December 2019 to April 30, 2021. Interaction of (D) 417N with C102 Nab (green), (E) 484K with C121 Nab (light pink), and (F) 501Y with hACE2 (yellow). The mutant residues are illustrated in orange, and the dashed lines represent interactions with adjacent residues. (G) Genome of the SARS-CoV-2 B.1.351 variant with identified nucleotide substitutions or deletions. Graphs were generated using Biorender, PyMOL, and RStudio. *Overlapping curves.

