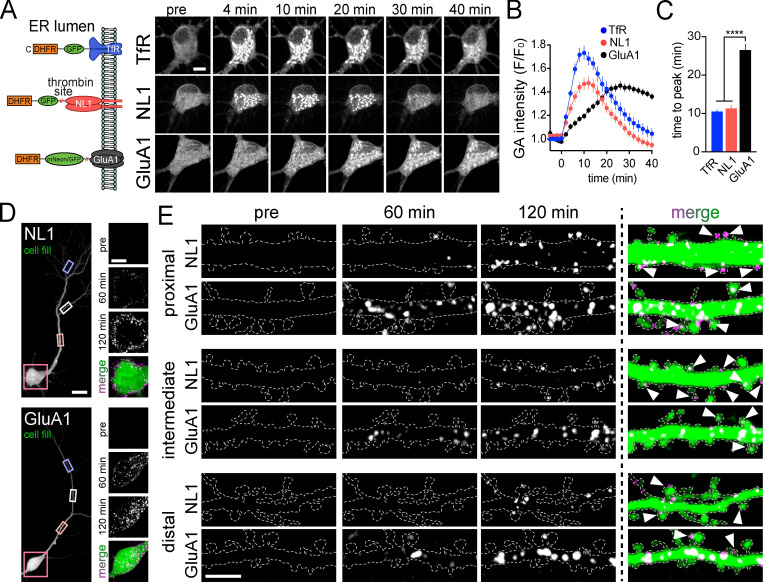
Figure 2.
Spatial and temporal properties of synaptic protein trafficking in hippocampal neurons following global ER release. (A) Schematic of constructs used for ER release experiments in hippocampal neurons. Right: Image series of TfR-GFP-DHFR (top), DHFR-GFP-NL1 (middle), and DHFR-mNeon-GluA1 (bottom) accumulation in the GA of hippocampal neurons following light exposure at time 0. Scale bar, 10 µm. (B) Time course of TfR-GFP-DHFR (blue), DHFR-GFP-NL1 (red), and DHFR-mNeon-GluA1 (black) trafficking to the GA following global (whole cell) light-triggered ER release; mean ± SEM (n = 11–27 cells from two or three independent experiments). (C) Comparison of the time to peak accumulation for TfR-GFP-DHFR (blue), DHFR-GFP-NL1 (red), and DHFR-mNeon-GluA1 (black) following ER release. ****, P < 0.0001 (one-way ANOVA, Tukey’s multiple comparisons test). (D) Surface expression of DHFR-GFP-NL1 (top) and DHFR-GFP-GluA1 (bottom) was detected by including Alexa647-anti-GFP in the extracellular solution. Somatic regions before and 60 min and 120 min following ER release are shown (right). Scale bar, 20 µm. Inset scale bar, 10 µm. (E) Appearance of DHFR-GFP-NL1 and DHFR-GFP-GluA1 at the surface of proximal (top), intermediate (middle), and distal (bottom) dendrites. Examples show surface signal before and 60 min and 120 min following ER release. Arrowheads denote spines with surface label. Scale bar, 5 µm.

