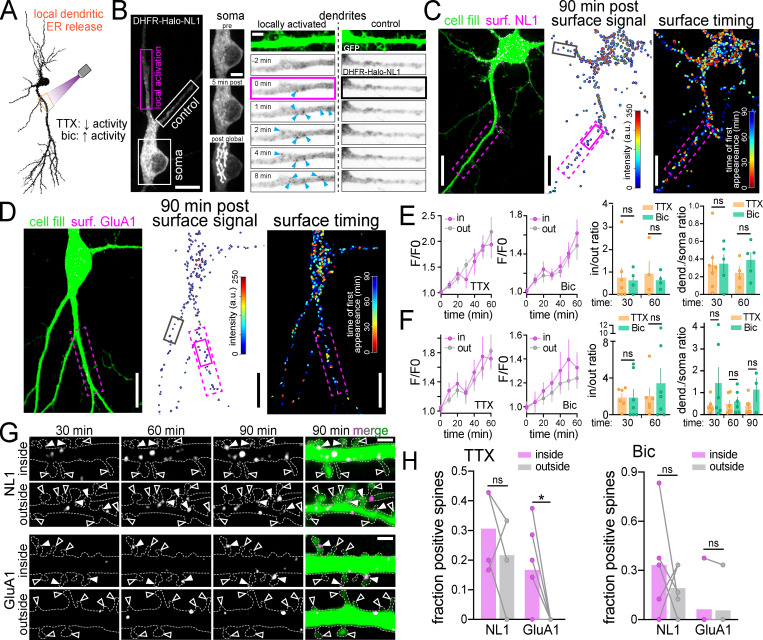
Figure 5.
Local ER release from dendrites reveals the rate, spatial dynamics, and activity dependence of remote secretory trafficking. (A) Schematic of experimental strategy. NL1 and GluA1 were locally released from a user-defined dendritic branch in the presence of either TTX to suppress or Bic to elevate neuronal activity. (B) Representative image (left) and time series of intracellular DHFR-HaloTag-NL1 (labeled with JF646) signal at the soma (center) and dendrites (right) shortly following local dendritic ER release (pink rectangle). Blue arrowheads mark the appearance of vesicular structures following illumination. The neighboring unstimulated control branch (white rectangle) is shown for comparison. At the end of the experiment, the cell was exposed to global full-field illumination and imaged 10 min later. Note the robust DHFR-GFP-NL1 accumulation in the somatic GA following global but not local dendritic release (middle). Scale bar, 10 µm; magnified panels, 5 µm. (C) Images showing cellular morphology (cell fill, left), DHFR-GFP-NL1 surface signal (center), and timing/location of surface trafficking (right) following local dendritic ER release. The photoactivated region is denoted by the dashed pink rectangle. The black and pink (solid lines) boxes denote the dendritic regions shown in G. Scale bars, 10 µm. (D) Images showing cellular morphology (cell fill, left), surface DHFR-GFP-GluA1 signal (center), and timing/location of surface trafficking (right) following local dendritic ER release (pink dashed rectangle). The black and pink (solid lines) boxes denote the dendritic regions shown in G. Scale bars, 10 µm. (E) Time course of DHFR-GFP-NL1 surface signal inside (in) and outside (out) the ER release zone in the presence of TTX (left) or Bic (right); mean ± SEM. No significant differences were found at any time point (two-way ANOVA, Bonferroni’s multiple comparisons test). The plots to the right show the ratio of signal in versus out of the release zone and the ratio of total dendritic to somatic signal 30 and 60 min following dendritic ER release in the presence of TTX (orange) or Bic (green); mean ± SEM (Student's t test; n = 4–7 from at least three independent experiments). (F) Time course of DHFR-GFP-GluA1 surface signal inside (in) and outside (out) the ER release zone in the presence of TTX (left) or Bic (right). No significant differences were found at any time point (two-way ANOVA, Bonferroni’s multiple comparisons test); mean ± SEM. The plots to the right show the ratio of signal in versus out of the release zone and the ratio of total dendritic to somatic signal 30 and 60 min following dendritic ER release in the presence of TTX (orange) or Bic (green); mean ± SEM (Student's t test; n = 3–7 from at least two independent experiments). (G) Image series of surface-labeled DHFR-GFP-NL1 (top) and DHFR-GFP-GluA1 (bottom) inside and outside the photoactivated region depicted in C and D. Solid and open arrowheads denote cargo-positive and -negative spines, respectively. Scale bars, 2 µm. (H) Comparison of the fraction of spines with DHFR-GFP-GluA1 or DHFR-GFP-NL1 within the release zone (purple) versus randomly selected regions of the same size in separate control dendrites (gray) 60 min following local dendritic ER release in the presence of TTX (left) or Bic (right); mean ± SEM; *, P < 0.05 (paired t test; n = 4–6 from at least three independent experiments). dend., dendritic; surf., surface.

