Figure S2.
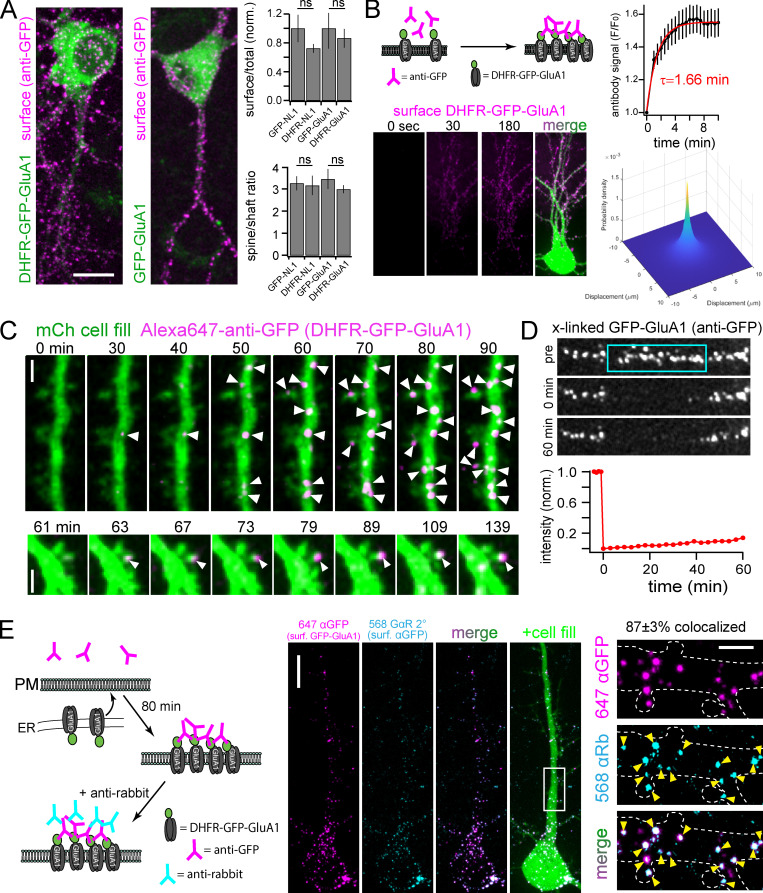
Localization of DHFR fused synaptic proteins and validation of antibody cross-linking for immobilizing surface proteins. (A) DHFR does not disrupt basal trafficking. Hippocampal neurons expressing the indicated constructs for 18 h (in the absence of zapalog) were labeled with Alexa647-anti-GFP under nonpermeabilizing conditions. The image panels show representative surface labeling (magenta) for DHFR-GFP-GluA1 (left) compared with GFP-GluA1 (right). The ratios of total surface (Alexa647-anti-GFP) to total (GFP) signal (top) and spine to shaft surface signal (bottom) are plotted for DHFR-GFP-NL1 and DHFR-GFP-GluA1 and compared with constructs without DHFR. The surface/total ratio signal is normalized to control (non-DHFR fused constructs); mean ± SEM, n = at least 8 neurons/condition from two separate cultures (Student’s t test). Scale bar, 10 µm. (B) Kinetics of Alexa647-anti-GFP binding to surface cargoes. Schematic of antibody cross-linking/labeling strategy is shown (top left). Bottom right: Antibody binding/cross-linking signal (magenta) measured in live neurons expressing DHFR-GFP-GluA1 immediately before and 30 s and 180 s following antibody addition. Kinetic data (top right) were fit with a single exponential (solid red line, τ = 1.66 min, n = 6 neurons). The two-dimensional plot (bottom right) models the probability of receptor localization following surface insertion and antibody cross-linking as a function of displacement from the membrane insertion site (see Materials and methods for details). Scale bar, 10 µm. (C) Representative examples of stable antibody binding to DHFR-GFP-GluA1 as it appears at the cell surface. A neuron expressing DHFR-GFP-GluA1 and cell fill (green) was imaged at the times indicated after ER release in the continuous presence of extracellular Alexa647-anti-GFP (magenta). Note the stable, sequential appearance of new surface puncta (arrowheads) on dendrites and select spines. Two representative examples are shown from different cells. Scale bar, 2 µm. (D) Alexa647-anti-GFP labeled DHFR-GFP-GluA1 is shown before, immediately following, and 60 min after photobleaching a small region (designated by blue box). Quantification of Alexa647 signal within the photobleached region is shown below; mean ± SEM (n = 10 dendritic regions from seven neurons). Scale bar, 5 µm. (E) The majority of cross-linked/labeled DHFR-GFP-GluA1 remains on the cell surface. DHFR-GFP-GluA1 was released from the ER and allowed to traffic to the surface for 80 min in the continuous presence of Alexa647- anti-GFP (magenta, generated in rabbit). Alexa647-anti-GFP was washed off, and Alexa568-anti-rabbit (teal) was added to label surface anti-GFP and confirm its localization at the cell surface. Magnified images of the highlighted region (white box) are shown to the right. Yellow arrowheads denote colocalized puncta. 87 ± 3% (mean ± SEM) of the Alexa647-anti-GFP puncta overlapped with Alexa568-anti-rabbit puncta. Data are averaged from five neurons. Scale bar, 10 µm (left); 2 µm (right). norm., normalized.

