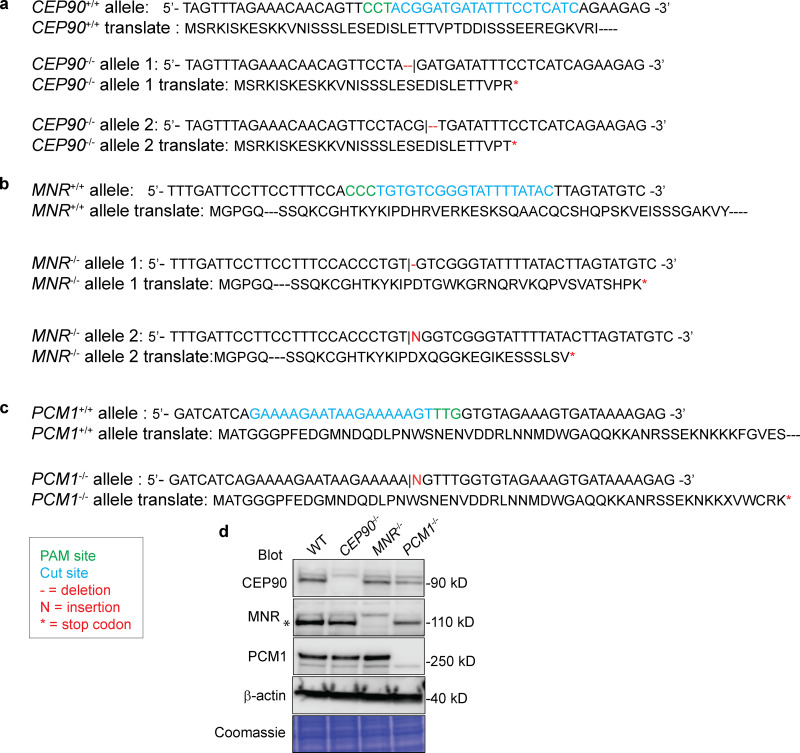
Figure S1.
Generation of CEP90−/−, MNR−/−, and PCM1−/− cell lines.(a–c) Sequence analysis of genomic DNA isolated from control and CEP90−/− (a), MNR−/− (b), and PCM1−/− (c) RPE1 cell lines generated using CRISPR-Cas9. Insertions and deletions, and translation products resulting from genome editing are indicated. The protospacer adjacent motif (PAM) is indicated in green. (d) Immunoblot analysis of whole-cell lysates from control, CEP90−/−, MNR−/−, and PCM1−/− RPE1 cell lines confirms loss of protein in mutant cell lines. The specific MNR band is indicated with an asterisk, and the top band is nonspecific.

