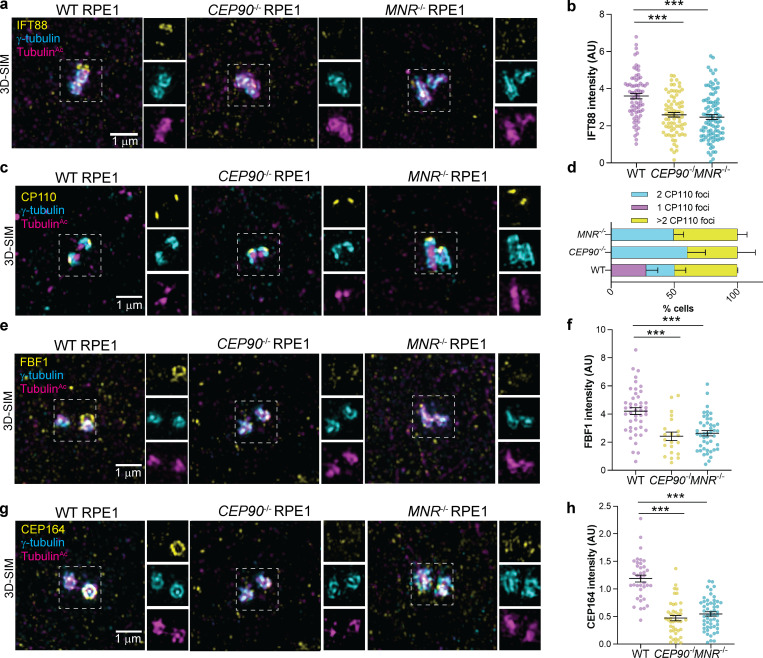
Figure S3.
CEP90 and MNR regulate distal appendage assembly irrespective of ciliation status. (a) Cycling WT, CEP90−/−, and MNR−/− RPE1 cells stained with antibodies to IFT88, γ-tubulin (centrosome marker), and TubulinAc (cilia and centriole marker). 3D-SIM imaging reveals IFT88 at the centrosome in WT, but not CEP90−/− and MNR−/−, cells. Scale bars for main panels and insets represent 1 µm. (b) Quantification of IFT88 fluorescence intensity at centrioles. Scatter dot plots show mean ± SEM. ***, P < 0.001, one-way ANOVA. n = 73–96 measurements. (c) Cycling WT, CEP90−/−, and MNR−/− RPE1 cells immunostained for CP110 (yellow), centrioles (FOP, cyan), and TubulinAc (cilia and centriole marker, magenta). Scale bar = 1 µm. (d) Quantification of CP110 foci. (e) Cycling WT, CEP90−/−, and MNR−/− RPE1 cells stained with antibodies to FBF1, γ-tubulin (centrosome marker), and TubulinAc (cilia and centriole marker). 3D-SIM imaging reveals FBF1 at the mother centriole in WT, but not CEP90−/− and MNR−/−, cells. Scale bars for main panels and insets represent 1 µm. (f) Quantification of FBF1 fluorescence intensity at centrioles. Scatter dot plots show mean ± SEM. ***, P < 0.001, one-way ANOVA. n = 21–45 measurements. (g) Cycling WT, CEP90−/−, and MNR−/− RPE1 cells stained with antibodies to CEP164, γ-tubulin (centrosome marker), and TubulinAc (cilia and centriole marker). 3D-SIM imaging reveals CEP164 at one of the two centrioles in WT, but not CEP90−/− and MNR−/−, cells. Scale bars for main panels and insets represent 1 µm. (h) Quantification of CEP164 fluorescence intensity at centrioles. Scatter dot plots show mean ± SEM. ***, P < 0.001, one-way ANOVA. n = 37–53 measurements.

