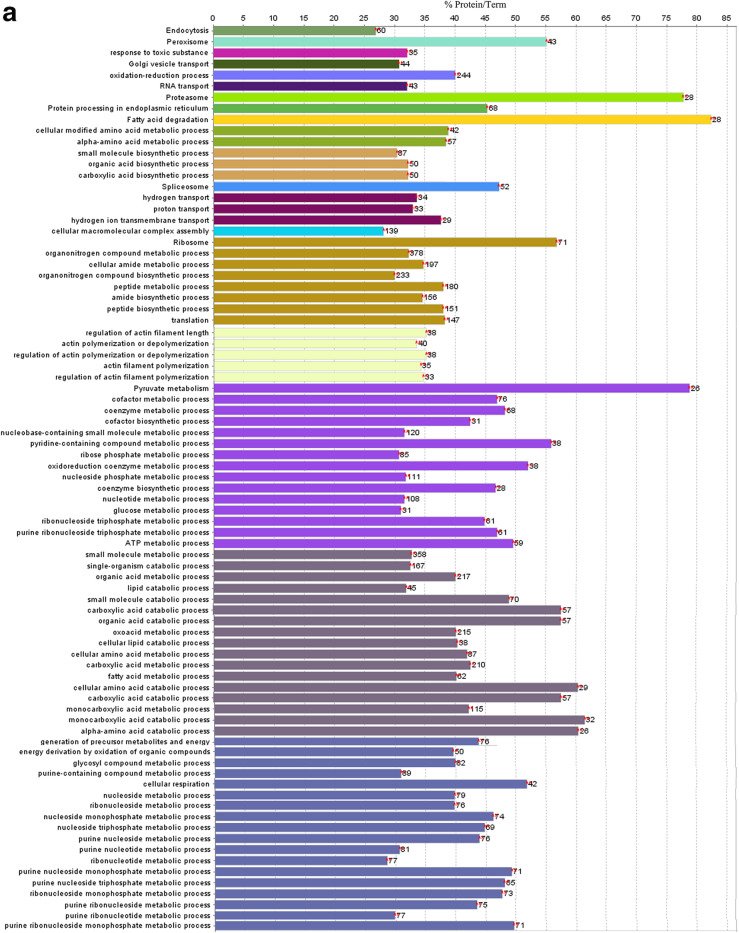
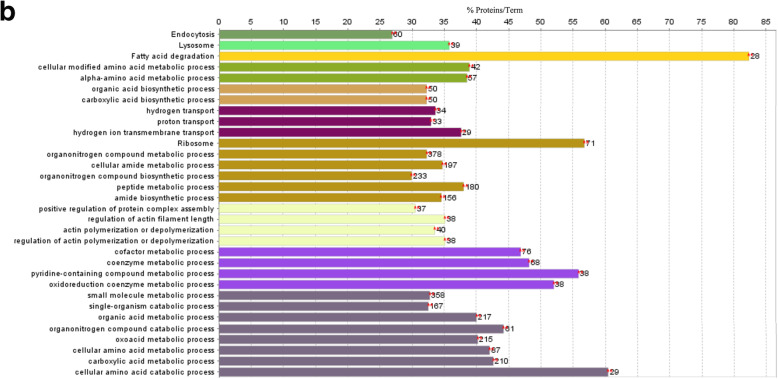
Fig. 2.
Qualitative proteome comparisons of the liver of broiler chickens in the control group and the immune stress group. a and b, GO and KEGG annotation of unique proteins specifically expressed in the control group and the immune stress group, respectively. Terms that begin with an uppercase or lowercase letters are KEGG or GO annotation, respectively. % Proteins/Term stands for the proportion of genes enriched in corresponding functional groups. The bars with the same color represent the same functional groups they belong to. The numbers stand for the genes enriched to the corresponding functional groups


