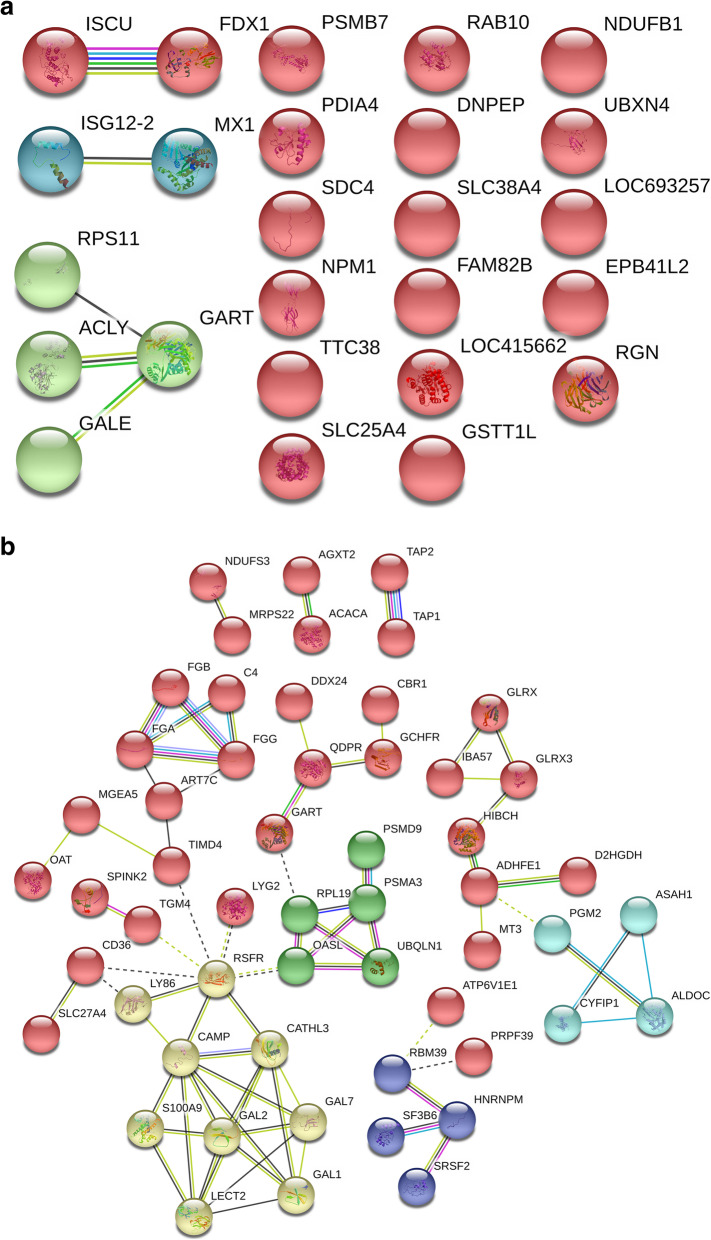
Fig. 4.
Protein and protein interaction network of differentially expressed proteins in the liver of broilers chickens in the immune stress group. A and B represent interaction network of down-regulated and up-regulated proteins in the liver of broilers chickens in the immune stress group, respectively .Each ball represents node protein, the same color balls represent node proteins clustered in the same sub network. The solid line indicates that the interaction score between the two proteins is more than 0.5 (the dotted line indicates that the score is less than 0.5). Different color solid lines between proteins represent evidence of association. Red lines indicate fusion evidence, green lines indicate neighborhood evidence, blue lines indicate co-occurrence evidence, purple lines indicate experimental evidence, yellow lines indicate text mining evidence, light blue lines indicate database evidence, and black lines indicate co-expression evidence

