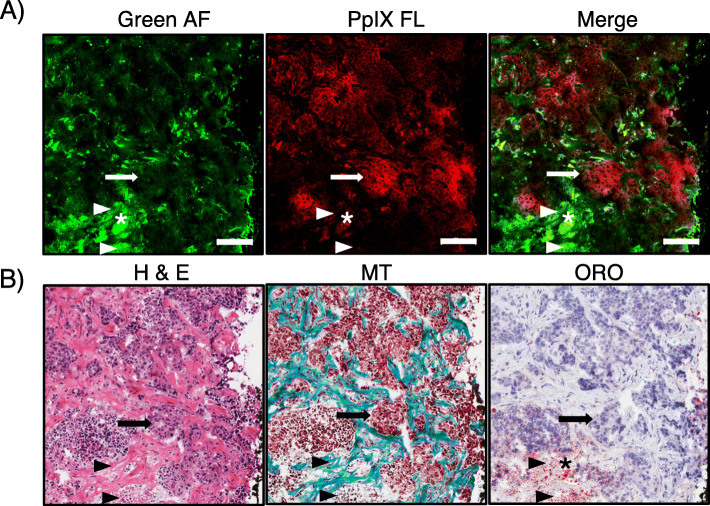
Fig. 4.
Cancer cell-specific localization of ALA-induced PpIX fluorescence. Representative A fluorescence microscopy and B corresponding histological images (bottom panel) from a biopsy collected inside the demarcated primary tumor boundary of a patient who received 30 mg/kg 5-ALA. The biopsy appeared red fluorescent with PRODIGI imaging. A Fluorescence microscopy was performed on cryosections cut from tumor core biopsies followed by B H&E, Masson’s Trichrome (MT), and Oil Red O (ORO) staining. Arrowheads depict green AF that was consistently observed in fibrous collagen tissue and in locations of necrosis, as confirmed with H&E and MT staining. Adipose tissue, identified by ORO staining, demonstrated both green and red AF (asterisk). PpIX fluorescence microscopic imaging confirmed cancer cell localization of PpIX (arrow), which was not observed during green AF imaging. Scale bar = 100 μm

