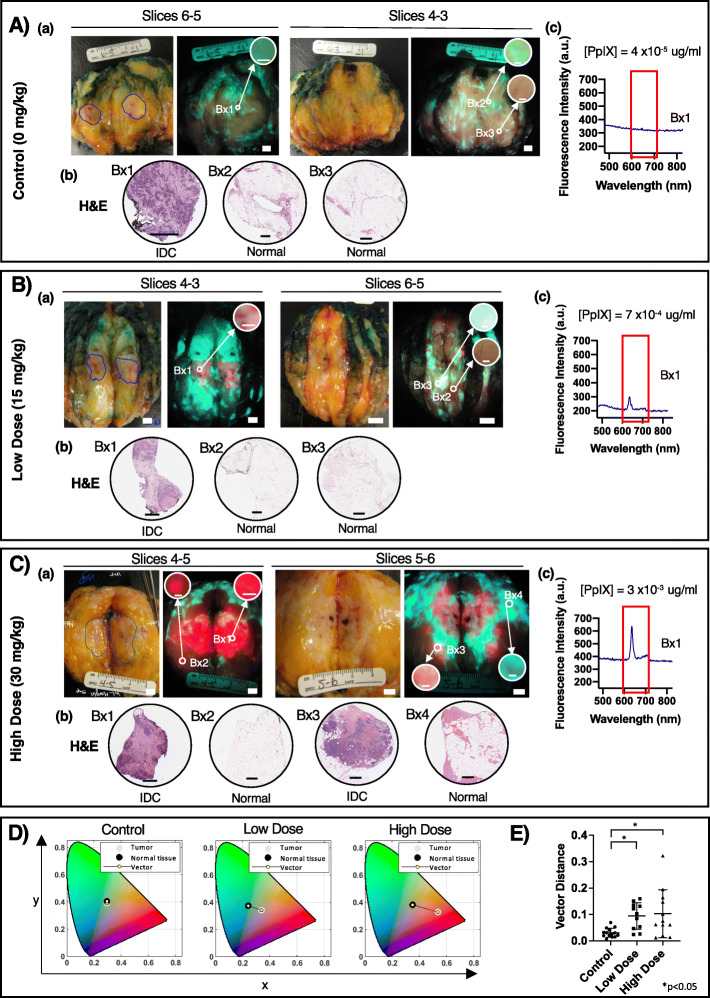
Fig. 5.
Ex vivo breast specimen fluorescence in patients with and without 5-ALA. Representative white light and fluorescence images with corresponding biopsy-based H&E and fluorescence spectra from patients with invasive ductal carcinoma receiving A no 5-ALA, B 15 mg/kg 5-ALA, or C 30 mg/kg 5-ALA. (a) Biopsies were collected in areas inside (Bx1) the PA demarcated tumor (blue line) and outside the demarcated tumor (Bx2-4) on an adjacent slice of the specimen. Circular insets are digitally magnified images of the biopsy areas demonstrating the fluorescence color. (b) H&E-stained longitudinal biopsy sections were examined by a blinded pathologist (S.J.D.) for the presence of cancer. (c) Point spectroscopy was performed at the Bx1 location and smoothed fluorescence spectra in the region of PpIX emission (red box, 635 nm peak) are presented. D Representative chromaticity diagrams (CIE xyY displaying the average pixel color inside the demarcated tumor border and outside to normal tissue contrast from fluorescence images of specimens from patients described in parts A–C of this figure. E Bar graph depicting the average vector distance between the average pixel color of the primary tumor and surrounding normal tissue. * p < 0.05, one-way ANOVA with multiple comparisons. Scale bar = 5 mm (a, white light and fluorescence images), 100 μm (a, inset), 500 μm (b, H&E sections). Bx, biopsy; IDC, invasive ductal carcinoma

