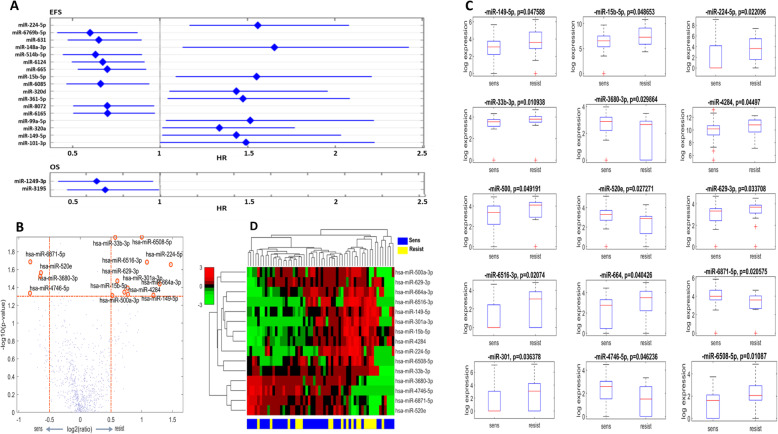
Fig. 2.
Identification of prognostic and predictive miRNAs in the IRE cohort. Forest plots indicating miRNAs with statistically significant (p < 0.05) impact on EFS and OS in the IRE cohort (a). Volcano plot showing the differentially expressed miRNAs between 39 platinum sensitive and 19 platinum resistant tumor samples (b). Box plots displaying miRNAs with statistically significant (Wilcoxon test, p < 0.05) differential expression between 39 platinum sensitive and 19 platinum resistant tumors (c). Heatmap illustrating the unsupervised hierarchical clustering analysis of the 15 miRNAs predictive of platinum sensitivity state (d), profiled on 39 platinum sensitive and 19 platinum resistant tumors. Abbreviations: HR = hazard ratio; sens = platinum sensitive; resist = platinum resistant

