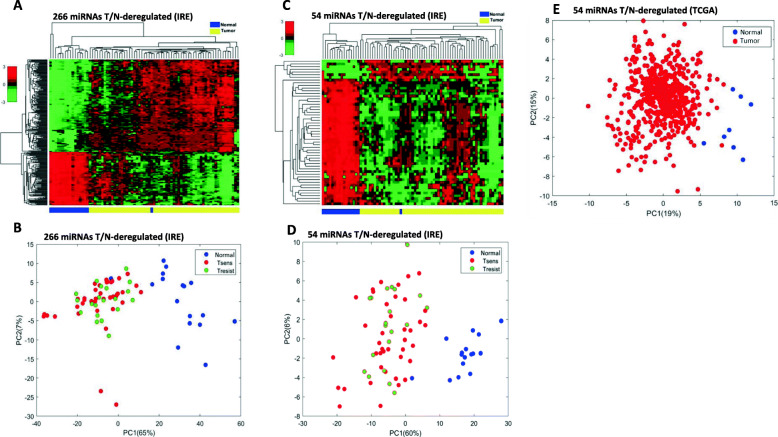
Fig. 3.
Dimensionality reduction analysis of differentially expressed miRNAs between tumor samples and normal. Unsupervised hierarchical clustering analysis (a) and principal component analysis (b) using the expression levels of the 266 miRNAs differentially expressed in tumor tissue versus normal tissue in the Regina Elena National Cancer Institute (IRE) cohort. These miRNAs separate the two types of samples, i.e., tumoral and normal tissue samples. This was confirmed by hierarchical clustering analysis in the IRE cohort (c), and by principal component analysis in the IRE cohort (d), and TCGA cohort (e), when using the 54 miRNAs validated against TCGA data. Statistical differences in miRNAs expression were assessed by permutation test and Student’t T-test. Abbreviations: T/N = tumor versus normal; Tsens = platinum sensitive tumor; Tresist = platinum resistant tumor; PC1 = first principal component; PC2 = second principal component; TCGA = The Cancer Genome Atlas

