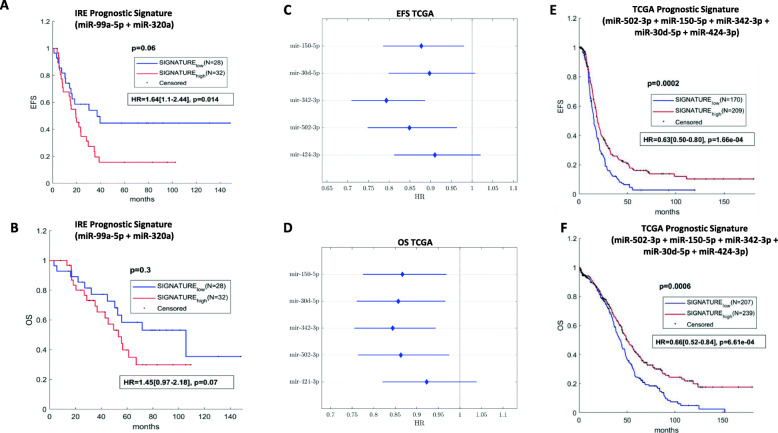
Fig. 4.
Characterization of miRNA prognostic signatures in the IRE and TCGA cohorts. Kaplan-Meier survival curves of event free survival (EFS) (a), and overall survival (OS) (b), of patients with low versus high expression of the 2-miRNA prognostic signature identified in the IRE cohort (statistically significant differences when logrank test p < 0.05). Forest plot illustrating univariate Cox regression analysis for EFS (c) and OS in the TCGA of the 5 miRNAs selected for the inherent prognostic signature (d). Kaplan-Meier survival curves of event free survival (EFS) (e), and overall survival (OS) (f), of patients with low versus high expression of the TCGA 5 miRNA prognostic signature (statistically significant differences when logrank test p < 0.05). Univariate Cox regression for prognostic signatures is displayed beneath the relative Kaplan-Meier curves, inside a rectangle. Abbreviations: HR = hazard ratio

