Fig. 1.
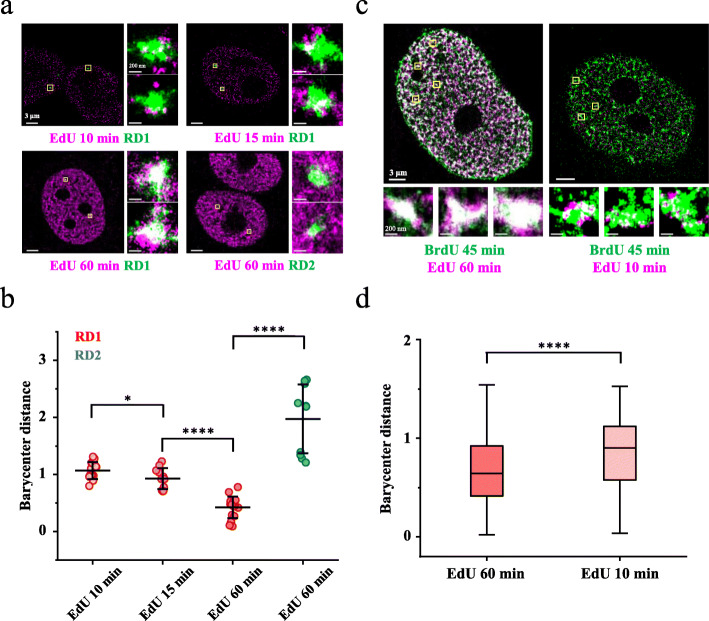
Super-resolution imaging of RFi and TADs in the S phase. a Representative STORM images of TAD1 and TAD2 labeled by Oligopaint probes (green) and RFi labeled metabolically for different durations (purple) (the “Methods” section). TAD1 and TAD2 were chosen based on the replication timing profile and Hi-C interaction heatmap of HeLa cells (Additional file 1: Figure S1). TAD1: an early replicating domain (Chr1:16911932-17714928). TAD2: a middle replicating domain (Chr1:17722716-18846245). Metabolic labeling of DNA replication was performed by supplying EdU to the cell upon release into the S phase for 10 min, 15 min, and 60 min (purple). The areas inside the yellow squares are shown at higher magnification to the right of each nucleus. Portions of the two signals that overlap are shown in white. b Barycenter distances between the TAD and its spatially associated RFi (the “Methods” section) in a. Horizontal lines and error bars represent the mean values ± s.d. of three or more independent biological replicates (n = 16 cells). c Representative STORM images of RFi labeled metabolically for different durations in two consecutive cell cycles. Consecutive metabolic labeling of DNA replication was performed by supplying BrdU (green) to the cell upon release into the S phase in the first cell cycle, followed by supplying EdU (purple) to the cell upon release into the S phase in the second cell cycle (for indicated durations). The areas inside the yellow squares are shown at higher magnification below each nucleus. d Box plot of barycenter distances between BrdU and EdU-labeled RFi in c (data were pooled from n = 10 cells). Center line, median; box limits, 25% and 75% of the entire population; whiskers, observations within 1.5× the interquartile range of the box limits. Significance was analyzed by an un-paired two sample parametric t test. ****P < 0.0001, ***P < 0.0005, **P < 0.01, *P < 0.05, N.S. not significant. 3D results are shown in Fig. S2&S5

