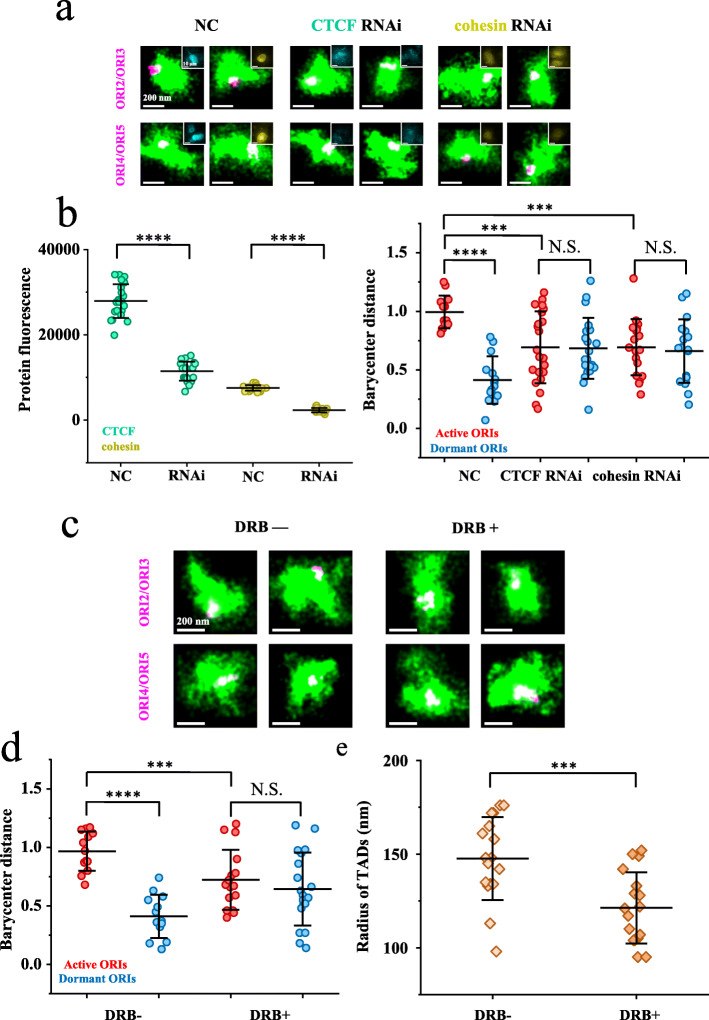
Fig. 3.
The spatial distribution of replication origins within the TADs at the G1/S transition is dependent on CTCF, cohesin, and transcription. a Representative STORM images of origins (purple) in TAD1 (green) after treatment of cells with the indicated siRNAs. Conventional images indicate the concentration of CTCF (cyan) or cohesin (yellow) in the nucleus. b Left panel, efficiency of RNAi indicated by fluorescence of CTCF or cohesion. Right panel, barycenter distances between high-efficiency or low-efficiency origins in TAD1 after treatment of cells with the indicated siRNAs. Portions of the two signals that overlap are shown in white. c Representative STORM images of origins (purple) in TAD1 (green). Left: no DRB. Right: with DRB. d Barycenter distances between high-efficiency/low-efficiency origins and TAD1 with or without DRB treatment. e Radius of TAD1 treated with or without DRB. For lines and statistics in b, d, and e, see the description in the legend of Fig. 1 (n ≥ 10 cells). 3D results are shown in Fig. S13

