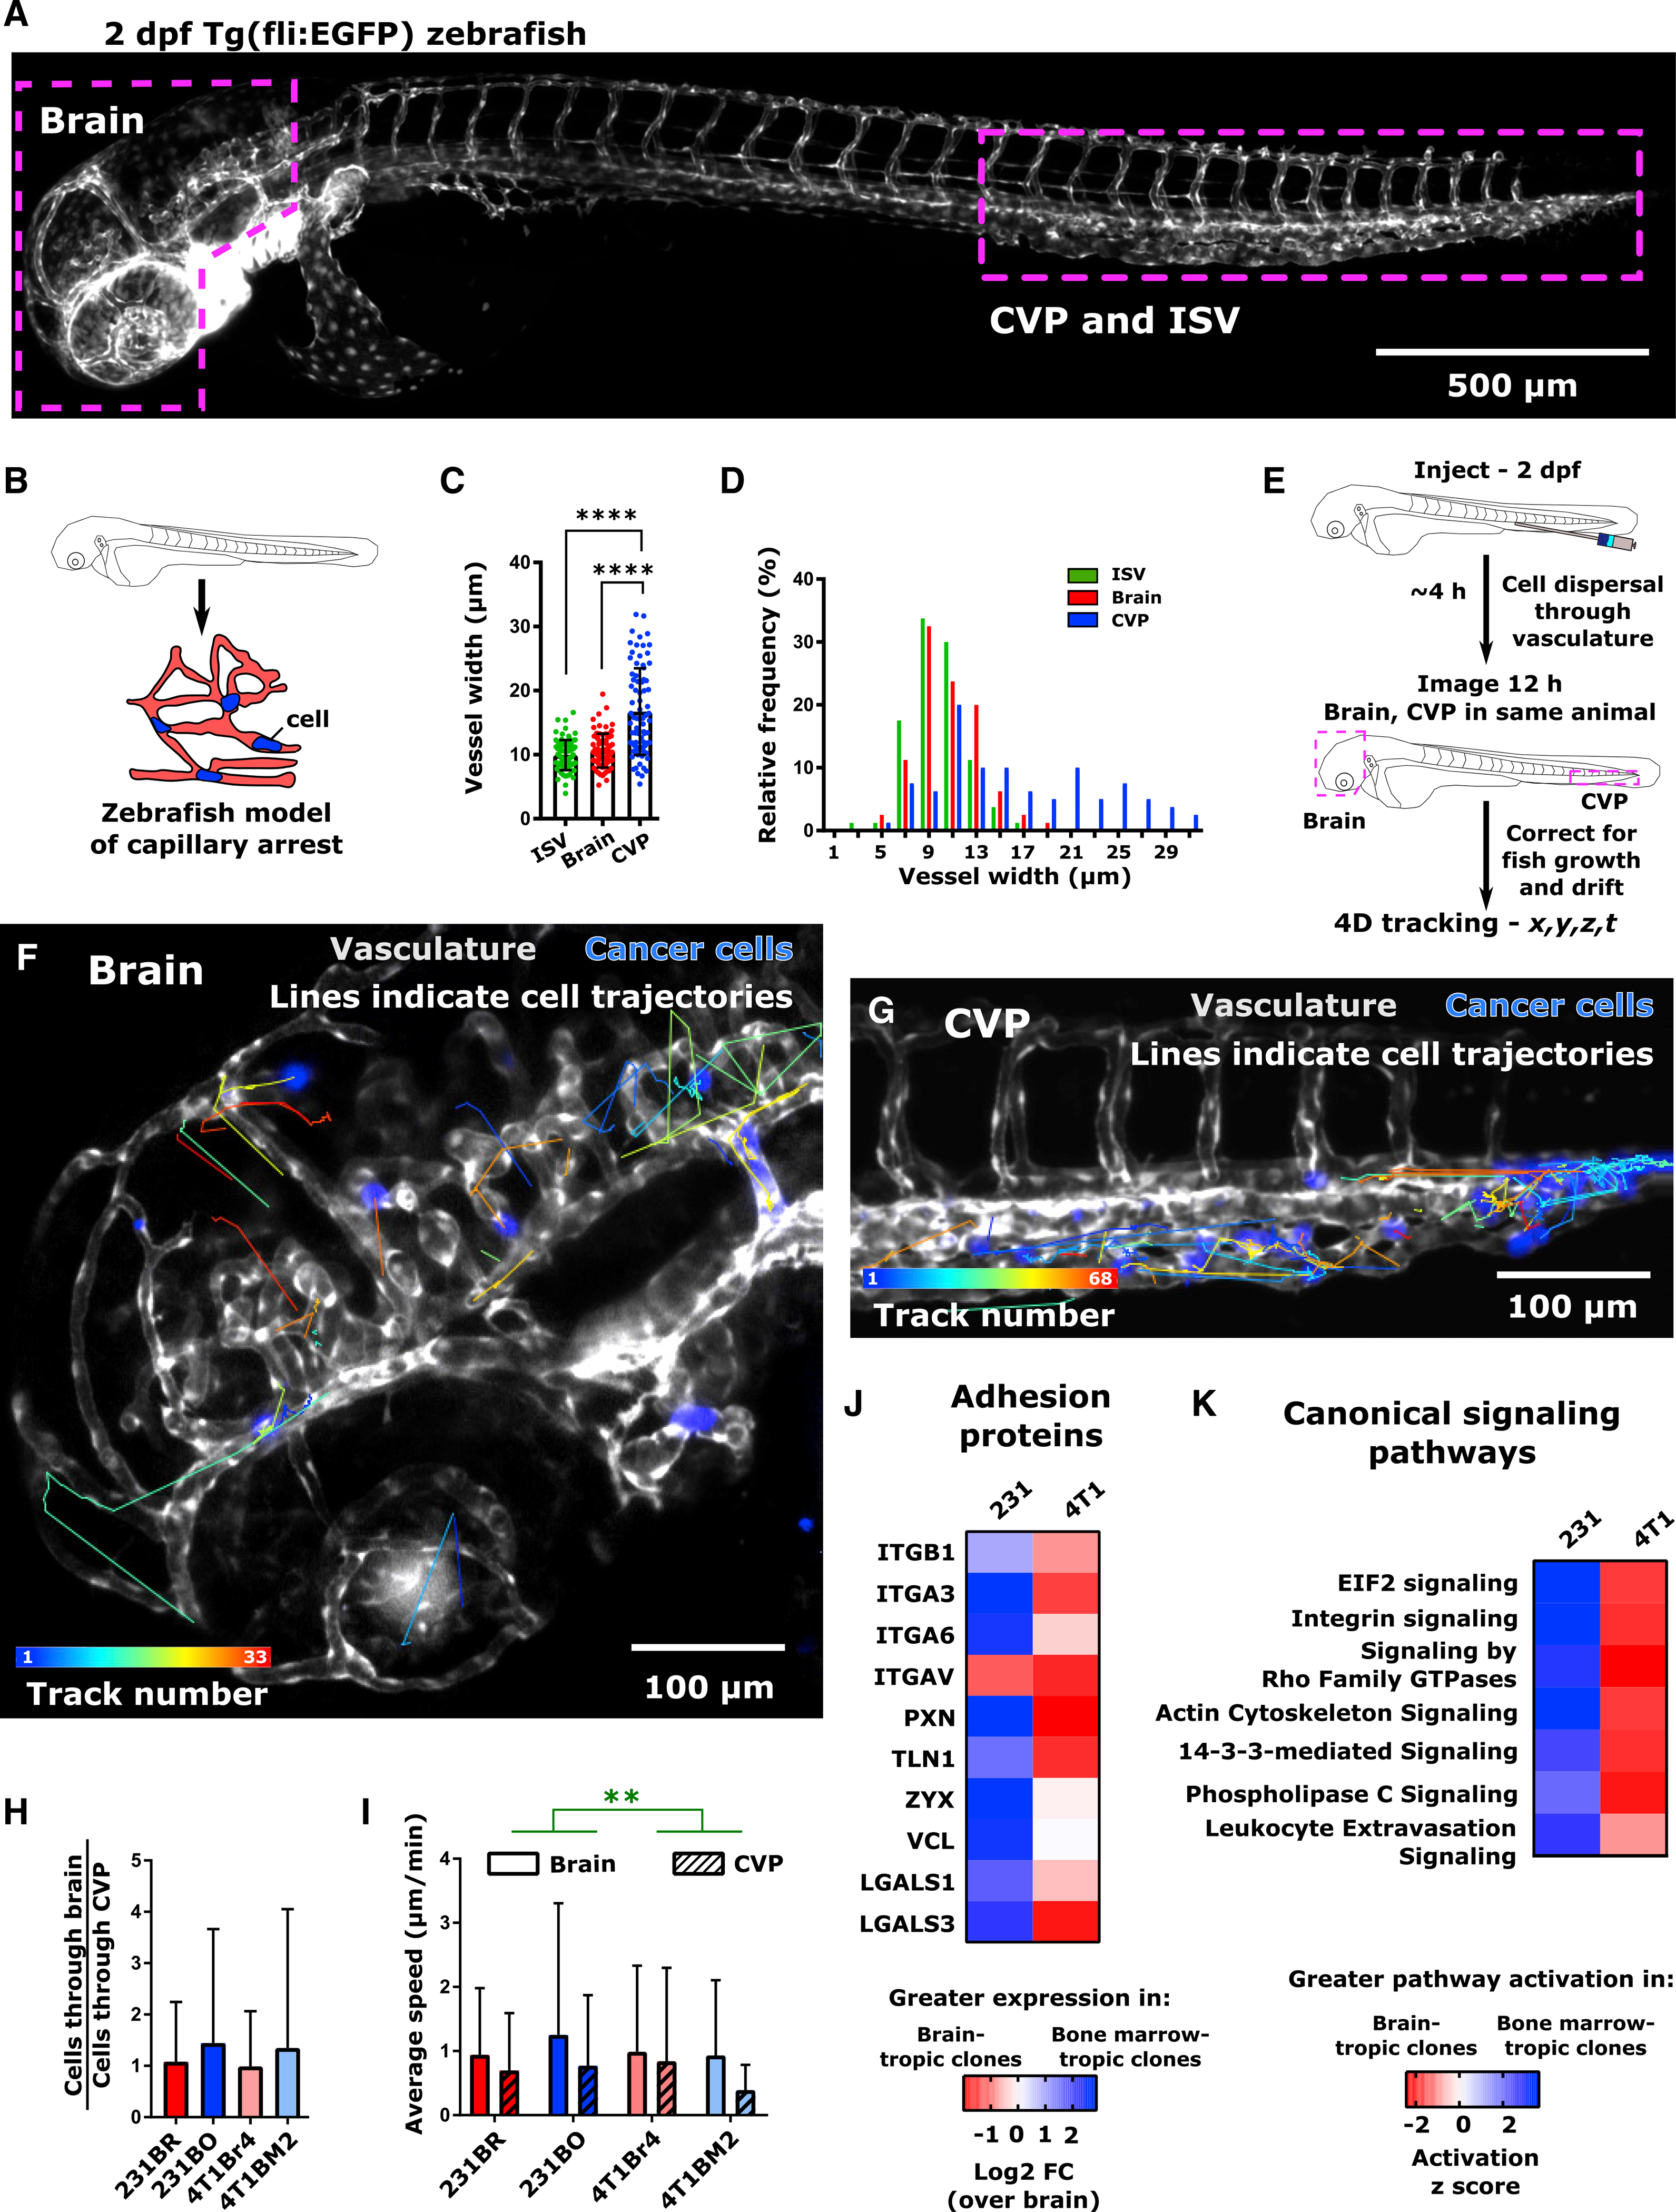
Figure 2. Cell Speed of Organ-Targeting Cell Line Clones Are Identical for a Given Organ Environment In Vivo.

(A) Overview image of 2 days post-fertilization (dpf) Tg(fli1:EGFP) zebrafish. The intersegmental vessels (ISV), caudal vein plexus (CVP), and brain are indicated.
(B) Schematic representation of zebrafish capillary arrest model. The size and architecture of the zebrafish vasculature make it analogous to an organism-scale capillary bed.
(C) Average ± SD and (D) distribution of blood vessel widths in the zebrafish ISV, CVP, and brain. Vessels were measured from four Tg(fli1:EGFP) zebrafish at 2 dpf, 20 vessels per region per fish, to obtain a total of N = 80 vessels at each location. ****p < 0.0001 by Dunn’s multiple comparisons post-test following Kruskal-Wallis test (p < 0.0001).
(E) Schematic of intravascular cell speed experiments.
(F and G) Representative images of cell trajectories within the zebrafish (F) brain and (G) CVP are shown. Trajectories are overlaid on average intensity projection of the t = 12 h image. Tracks are pseudocolored by track number (blue, first track; red, final track). Cells (231BR) are displayed in blue. Zebrafish vasculature and venous circulation are shown in grayscale to facilitate visualization of cell trajectories. Scale bar, 100 μm.
(H) Per larva ratio of cells tracked in the brain to cells tracked in the CVP for both brain-tropic and bone-marrow-tropic cells. Plot displays mean ± SD for this ratio averaged across N = 7 larvae for 231BR cells (310 cells total), N = 10 larvae for 231BO cells (183 cells total), N = 6 larvae for 4T1Br4 cells (139 cells total), and N = 8 larvae for 4T1BM2 cells (96 cells total). Differences were not significant by Dunn’s multiple comparisons test between each cell type following Kruskal-Wallis test (p = 0.5516).
(I) Average ± SD speeds of cells moving through the brain and CVP. Speeds are grouped measurements (231BR cells, N = 91 cells in brain, N = 131 cells in CVP; 231BO cells – N = 46 cells in brain, N = 56 cells in CVP; 4T1Br4 cells – N = 48 cells in the brain, N = 60 cells in the CVP; 4T1BM2 cells – N = 22 cells in the brain, N = 65 cells in the CVP) taken from multiple fish (231Br – 6 larvae; 231BO – 8 larvae; 4T1Br4 – 6 larvae; 4T1BM2 – 8 larvae). **p = 0.0025 by two-way ANOVA, with tissue (F = 9.218, DF = 1) but not cell type as a significant source of variation.
(J) Relative expression of adhesion proteins in 231 and 4T1 bone-marrow-targeting cell clones, relative to expression in brain-targeting clone of each cell line. Heatmap color indicates log2 fold change compared to brain-targeting clone. Protein expression levels were from whole-lysate mass spectrometry, from lysates taken from three independent experiments. Significance levels are not indicated.
(K) Comparison of canonical signaling pathway activation between 231 and 4T1 organ-targeting clones. On heatmap, blue indicates greater pathway activation in bone-marrow-tropic clones and red indicates greater pathway activation in brain-tropic clones by activation Z score in ingenuity pathway analysis (IPA). Pathways were sorted by Z Score using IPA comparison analysis. See also Figure S4.
