
Figure 3. Organ-Targeting Cell Line Clones Move at Identical Speeds In Vitro for a Given Microenvironment.
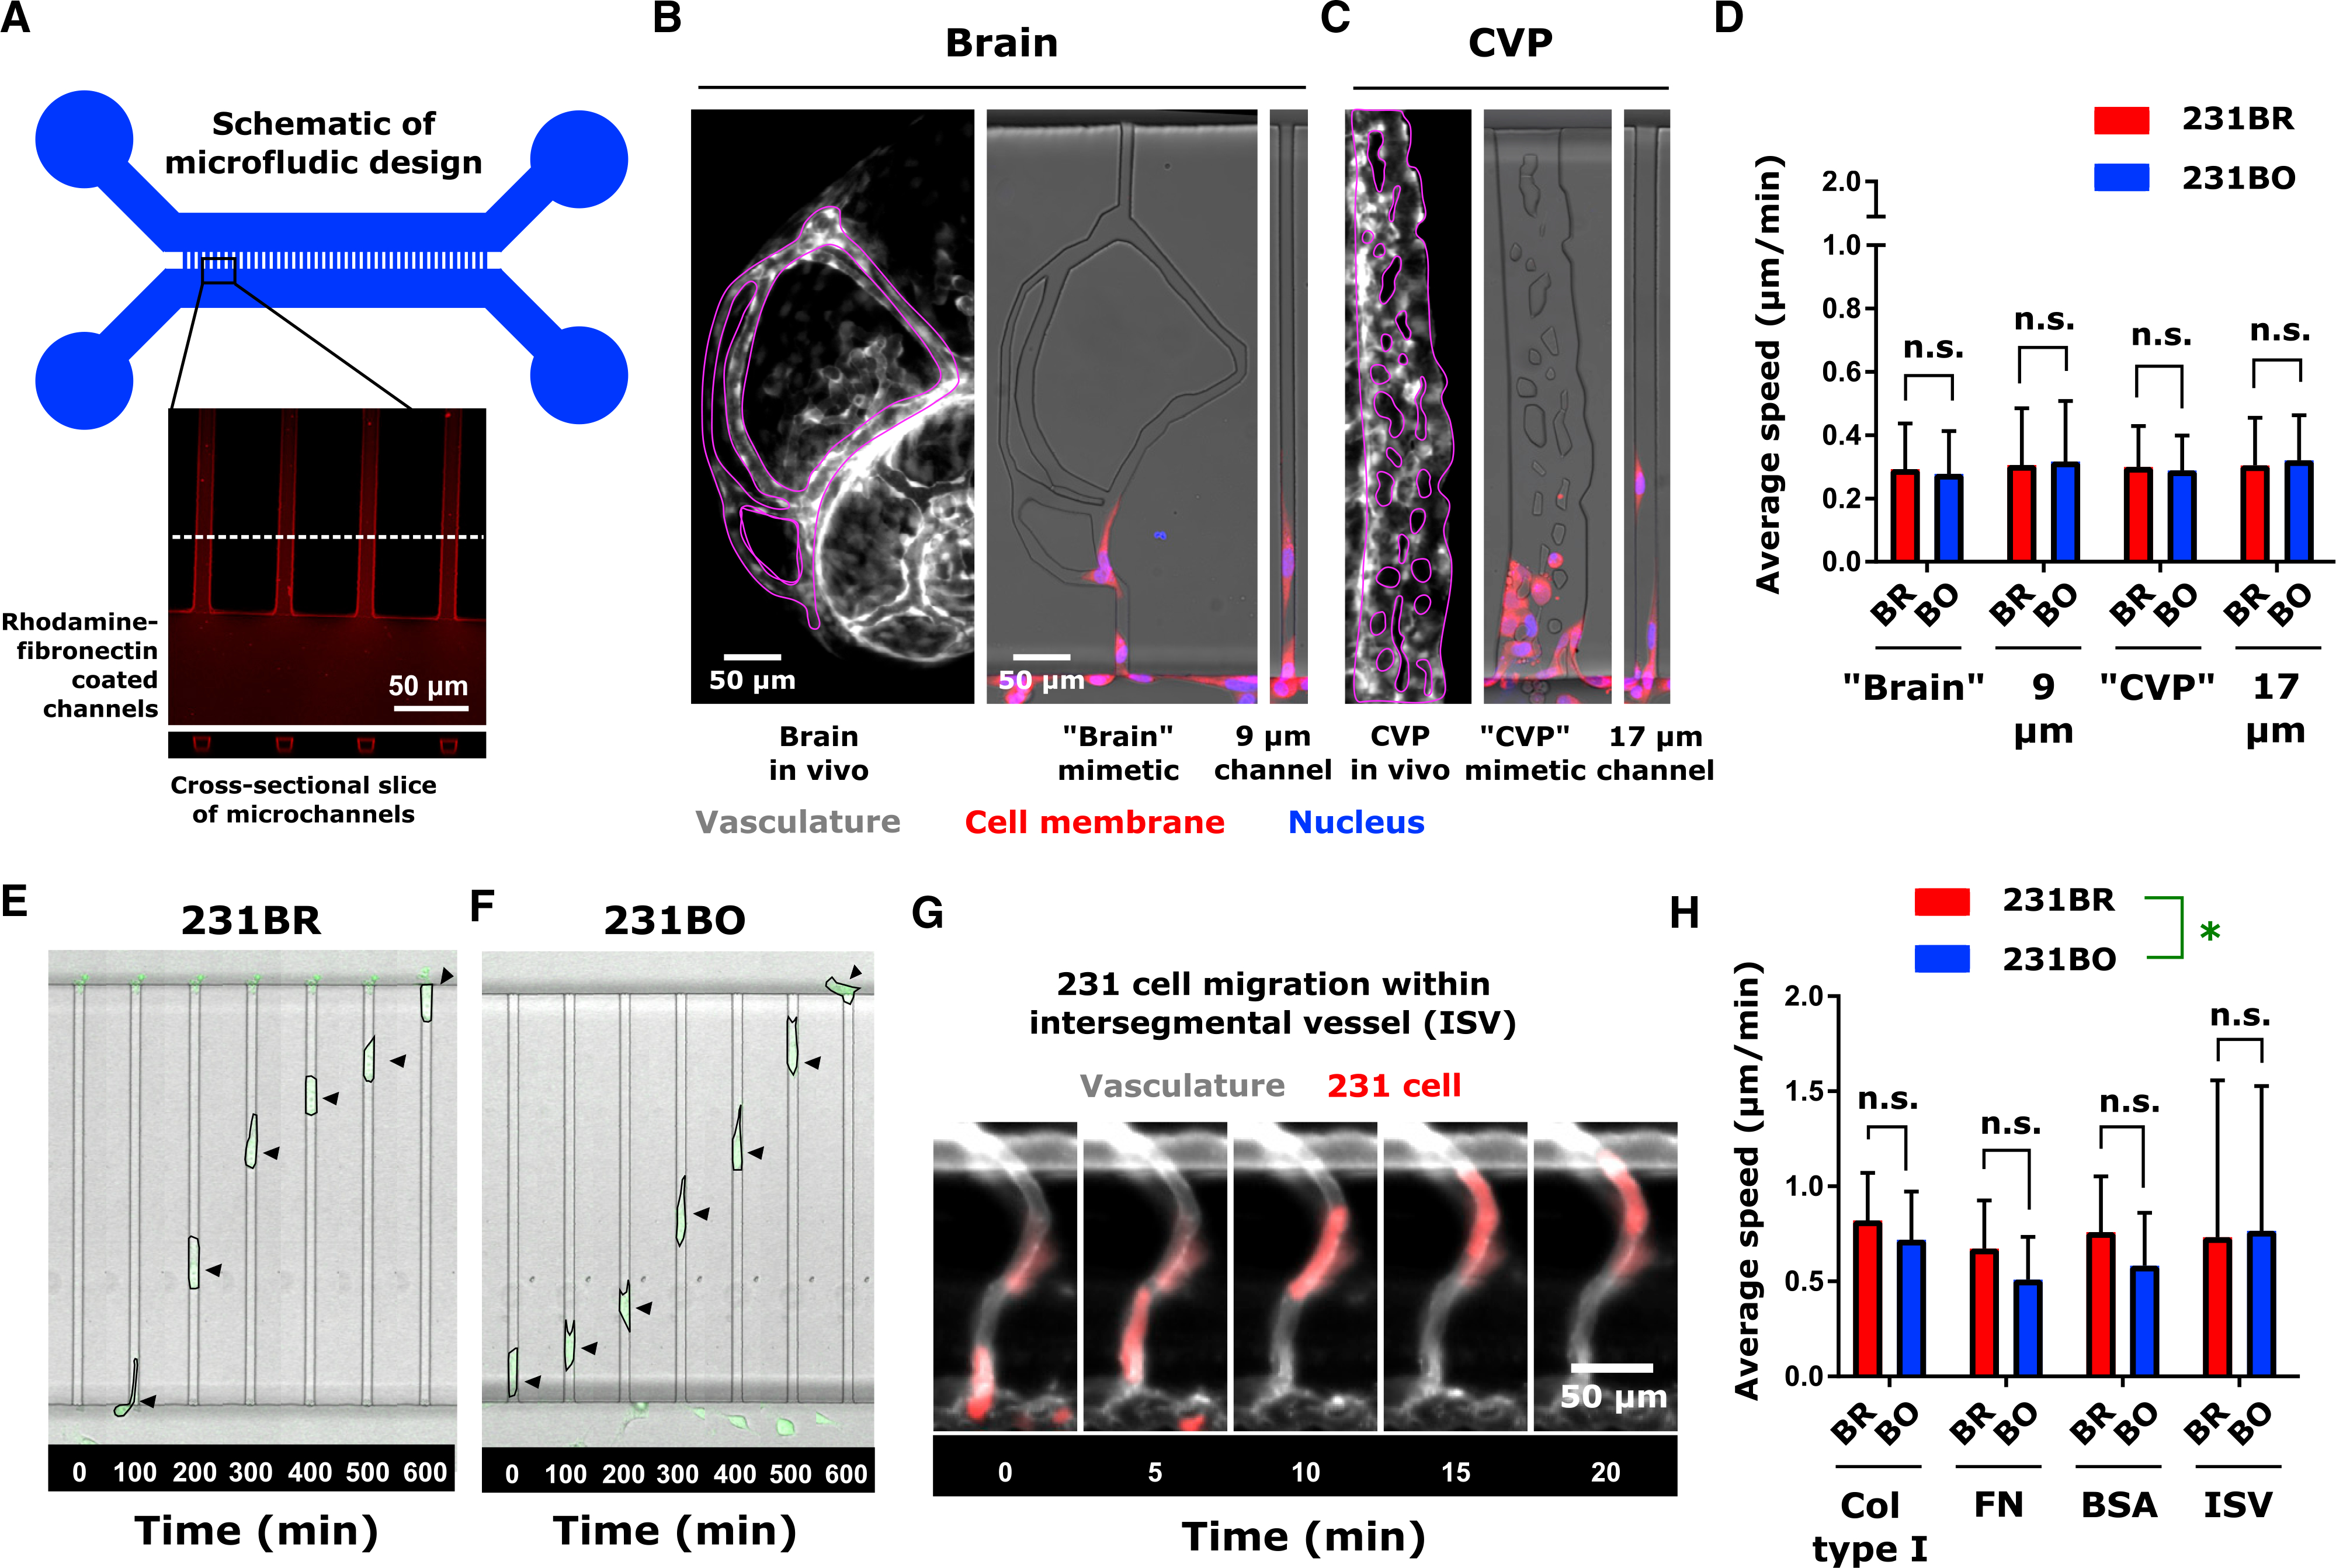
(A) Schematic of microfluidic device. Microchannel inset shows average intensity projection of rhodamine-fibronectin coated microchannels, with a cross-sectional slice to demonstrate the rectangular channel cross section. Microchannel walls were coated with proteins by adsorption, while the interiors of the channels were open.
(B) Vasculature (gray scale) in the zebrafish brain, corresponding “brain” mimetic microchannels, and 9 μm-wide microchannel (average width of vessels in brain; see Figure 2).
(C) Vasculature (gray scale) in the zebrafish CVP, corresponding “CVP” mimetic microchannels, and 17 μm-wide microchannel (average width of vessels in CVP; see Figure 2). In (C) and (D), vasculature images are from 2 dpf Tg(fli1:EGFP) zebrafish, with regions of interest outlined in magenta. Cell membranes are displayed in red and the cell nucleus in blue for in vitro images. Scales are indicated.
(D) Average ± SD speed of cells migrating in microfluidic channels of varying topography. Channels were coated with 10 μg/mL fibronectin. Speeds were calculated from at least 41 cells per condition over 4 biological replicates: 231BR, brain mimetic − N = 41; 231BO, brain mimetic − N = 42; 231BR, 9 μm wide − N = 42; 231BO, 9 μm wide – N = 46; 231BR, CVP mimetic – N = 120; 231BO, CVP mimetic – N = 118; 231BR, 17 μm wide – N = 90; 231BO, 17 μm wide – N = 81. Neither cell type (p = 0.9847, F = 0.0003680, DF = 1) nor microchannel topography (p = 0.3561, F = 1.082, DF = 3) was significant source of variation by two-way ANOVA. Speed differences between cell types were not significant (n.s.) in a given environment by Sidak’s multiple comparisons post-test.
(E and F) Time-lapse images of (E) 231BR cells and (F) 231BO cells migrating through confining microchannels coated with 20-μg/mL rat tail collagen type I. Arrows indicate cell position. For scale, microchannel width, 8 μm.
(G) Representative image of MDA-MB-231 cell (red) migrating through Tg(fli1:EGFP) zebrafish intersegmental vessel (ISV; gray). Arrow indicates cell location. Scale is indicated.
(H) Average speeds (mean ± SD) of cells migrating in microchannels and zebrafish intersegmental vessels. In the microchannels, speeds from at least 52 cells collected over at least 2 biological replicates were measured: 231BR, collagen type I – N = 60 cells, 2 biological replicates; 231BO, collagen type I – N = 60 cells, 2 biological replicates; 231BR, fibronectin – N = 60 cells, 2 biological replicates; 231BO, fibronectin – N = 60 cells, 2 biological replicates; 231BR, BSA – N = 52 cells, 3 biological replicates; 231BO, BSA – N = 57 Cells, 3 biological replicates. Speeds in the intersegmental vessels were measured for N = 38 brain-tropic cells from 6 larvae and N = 14 bone-marrow-tropic cells from 7 larvae. For a given microchannel protein coating and within the ISV, speeds were not significantly different (NS) by Sidak’s multiple comparisons post-test following two-way ANOVA, though cell type (*p = 0.0157, F = 5.888, DF = 1) and ECM coating (p = 0.0115, F = 3.727, DF = 3) were significant sources of variation. See also Figure S4.