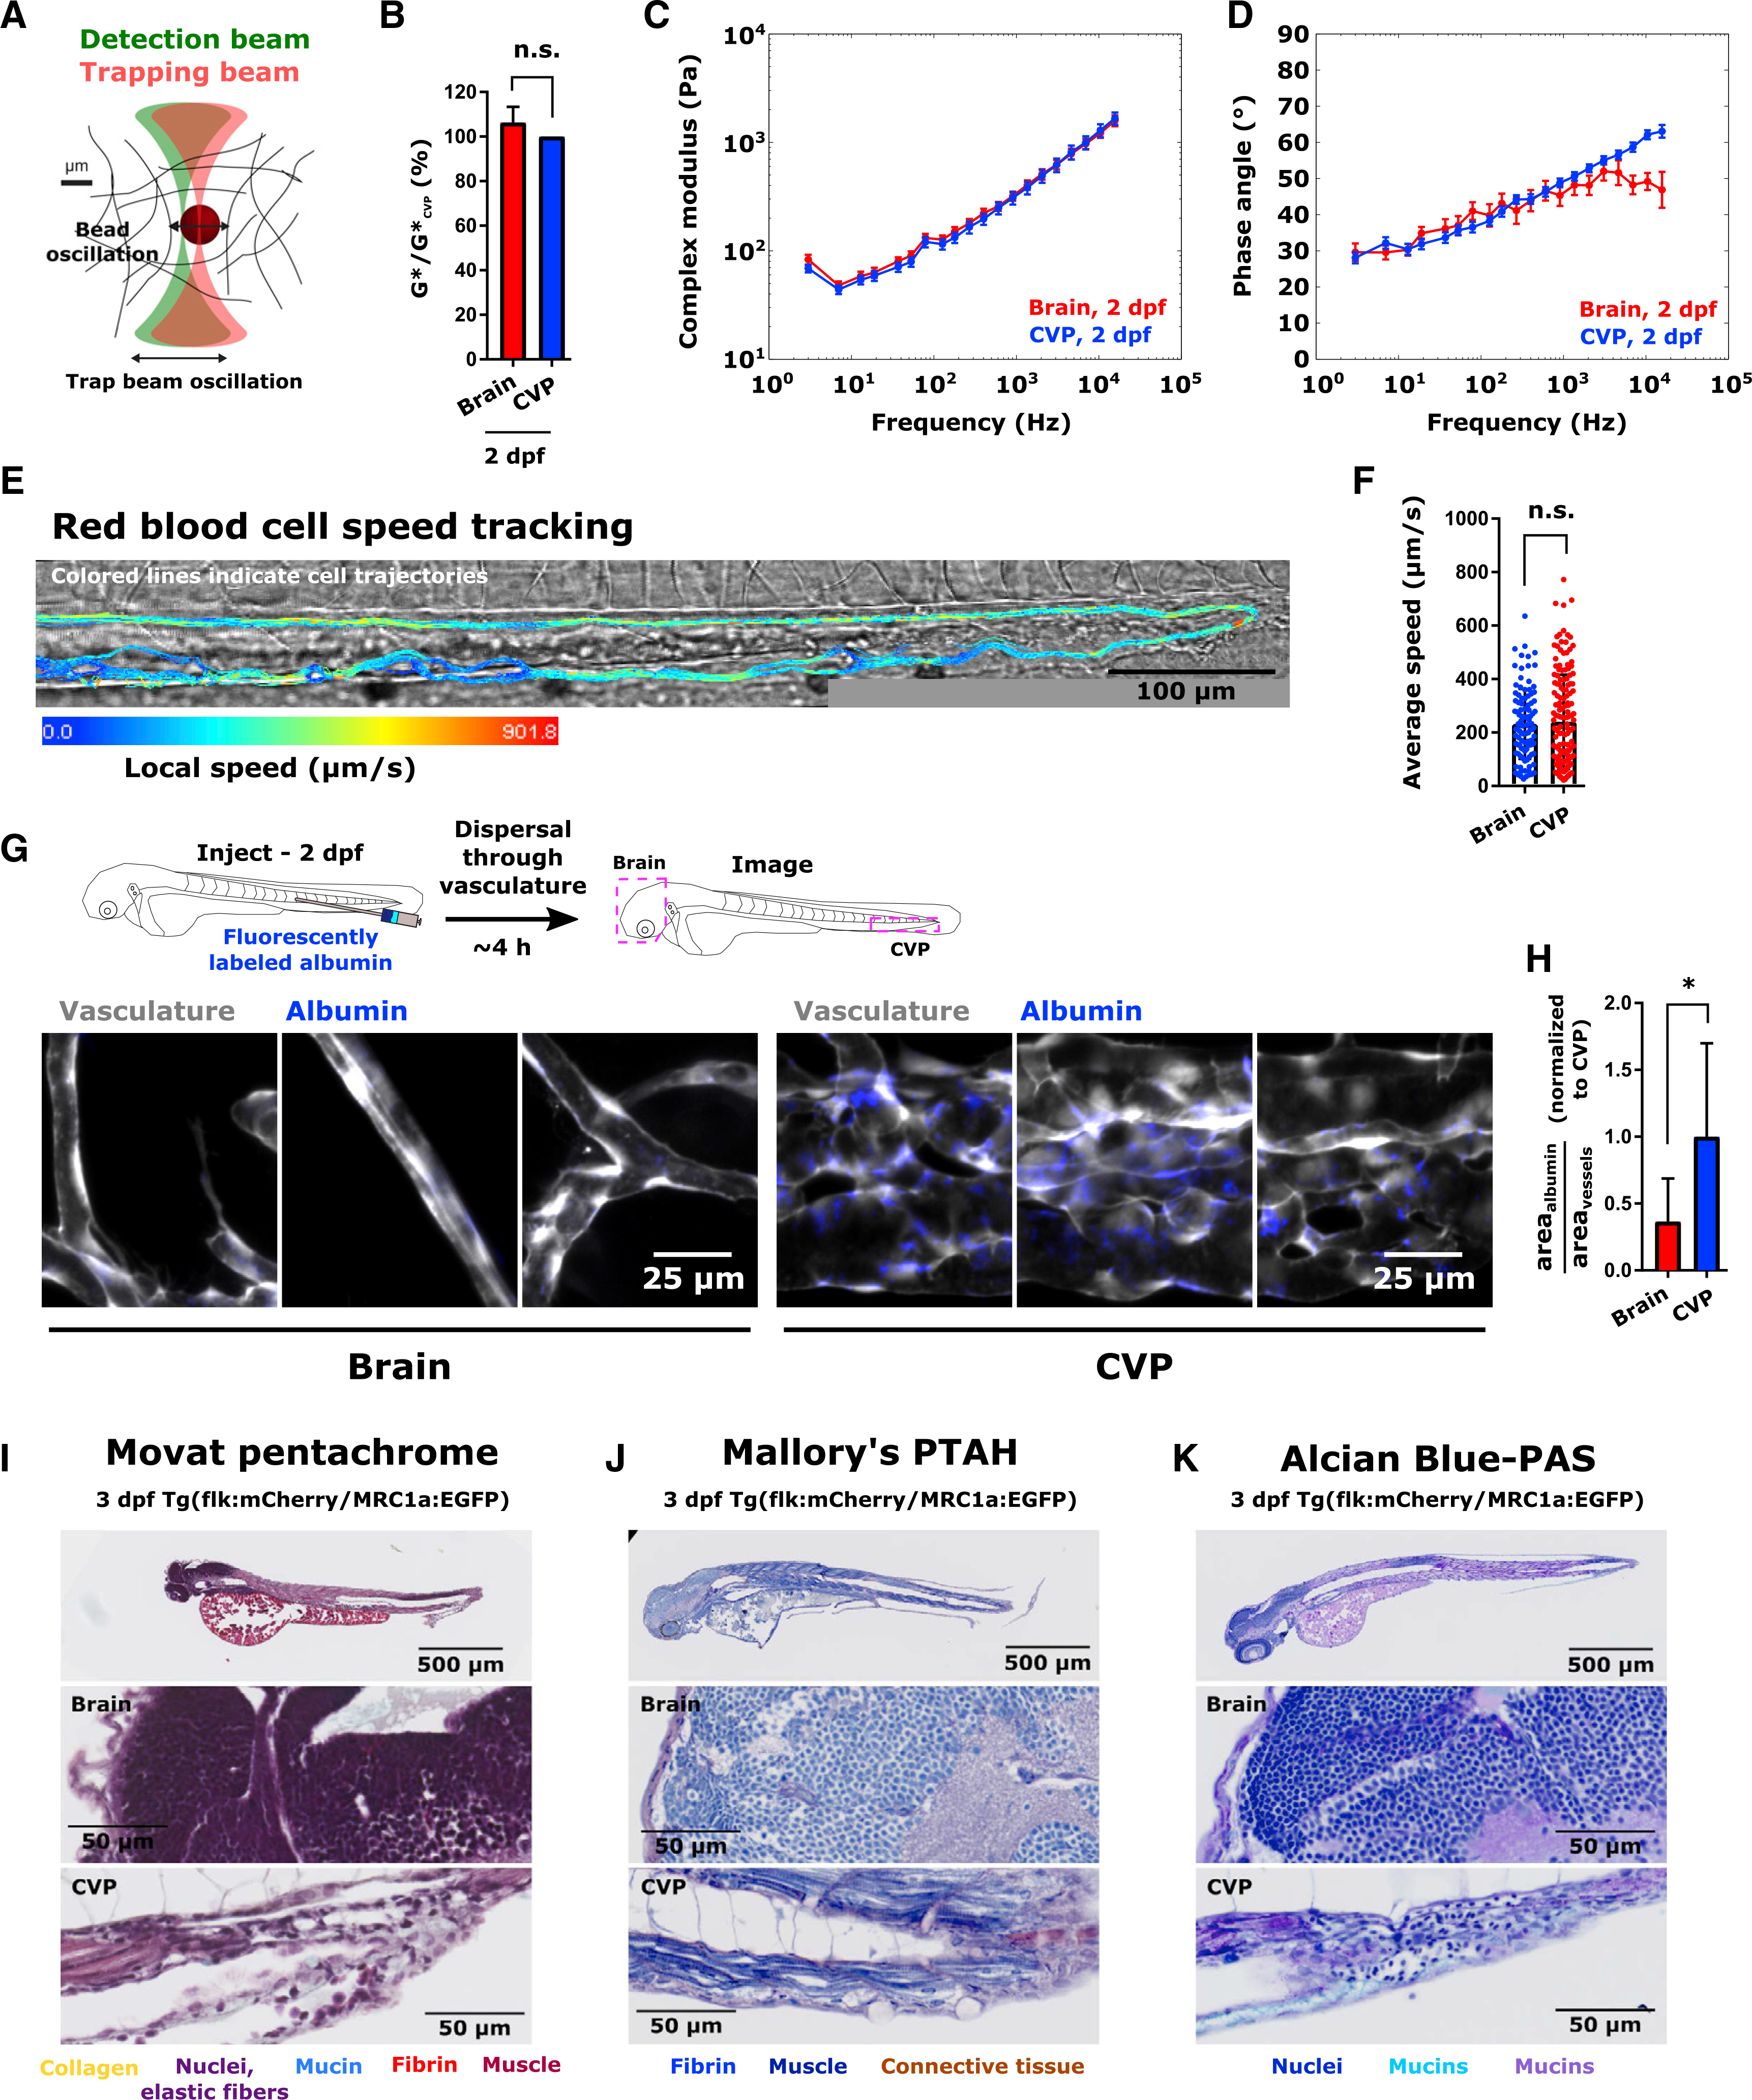
Figure 4. Characterization of the Zebrafish Metastatic “Soil”.

(A) Schematic of optical trap-based microrheology.
(B) Mean ± SD complex modulus in the brain and CVP at 2 dpf, normalized to the mean complex modulus in the CVP on the same day. n.s., not statistically significantly different by Tukey’s honestly significant difference test following two-way ANOVA.
(C) Complex modulus (mean ± SEM) versus frequency curves and (D) phase angle (mean ± SEM) versus frequency curves obtained using optical trap-based microrheology in zebrafish brain and CVP at 2 dpf. Samples were measured in triplicate with at least 30 beads per sample measured.
(E) Red blood cell flow trajectories in CVP of 2 dpf Tg(flk:MCherry/MRC1a:EGFP) larva. Color of trajectory indicates local speed. Scale is indicated.
(F) Mean ± SD red blood cell flow speed in brain and CVP at 2 dpf. Points indicate average speed of an individual cell over the duration of tracking. Bar represents ensemble mean speed. Speeds were measured in the brain and CVP of 4 larvae (N = 102 cells in the brain, N = 160 cells in the CVP, maximum of 40 measurements per larva per tissue of interest). n.s., not significantly different by two-tailed Mann-Whitney test (p = 0.7111).
(G) Schematic and images of fluorescently labeled albumin (blue) accumulation in the glycocalyx of the brain and CVP in 2 dpf Tg(flk:MCherry/MRC1a:EGFP) larvae. Images were acquired ~4 h after albumin injection and are maximum intensity projections of confocal slices. Scale is indicated.
(H) Area coverage of fluorescent albumin as a fraction of total area of vessels in a given region of interest (mean ± SD), normalized to the average ratio in the CVP. In each tissue, 3 images were obtained from 3 larvae (N = 9 per tissue). *p = 0.0306 by unpaired two-tailed t test with Welch’s correction.
(I–K) Histological staining with (I) Movat Pentachrome, (J) Mallory’s PTAH, and (K) Alcian Blue-PAS in 3 dpf Tg(flk:MCherry/MRC1a:EGFP) larvae. Insets in the brain and CVP are shown. Scale is indicated. Color of labels indicate color of corresponding structures in histology images.
