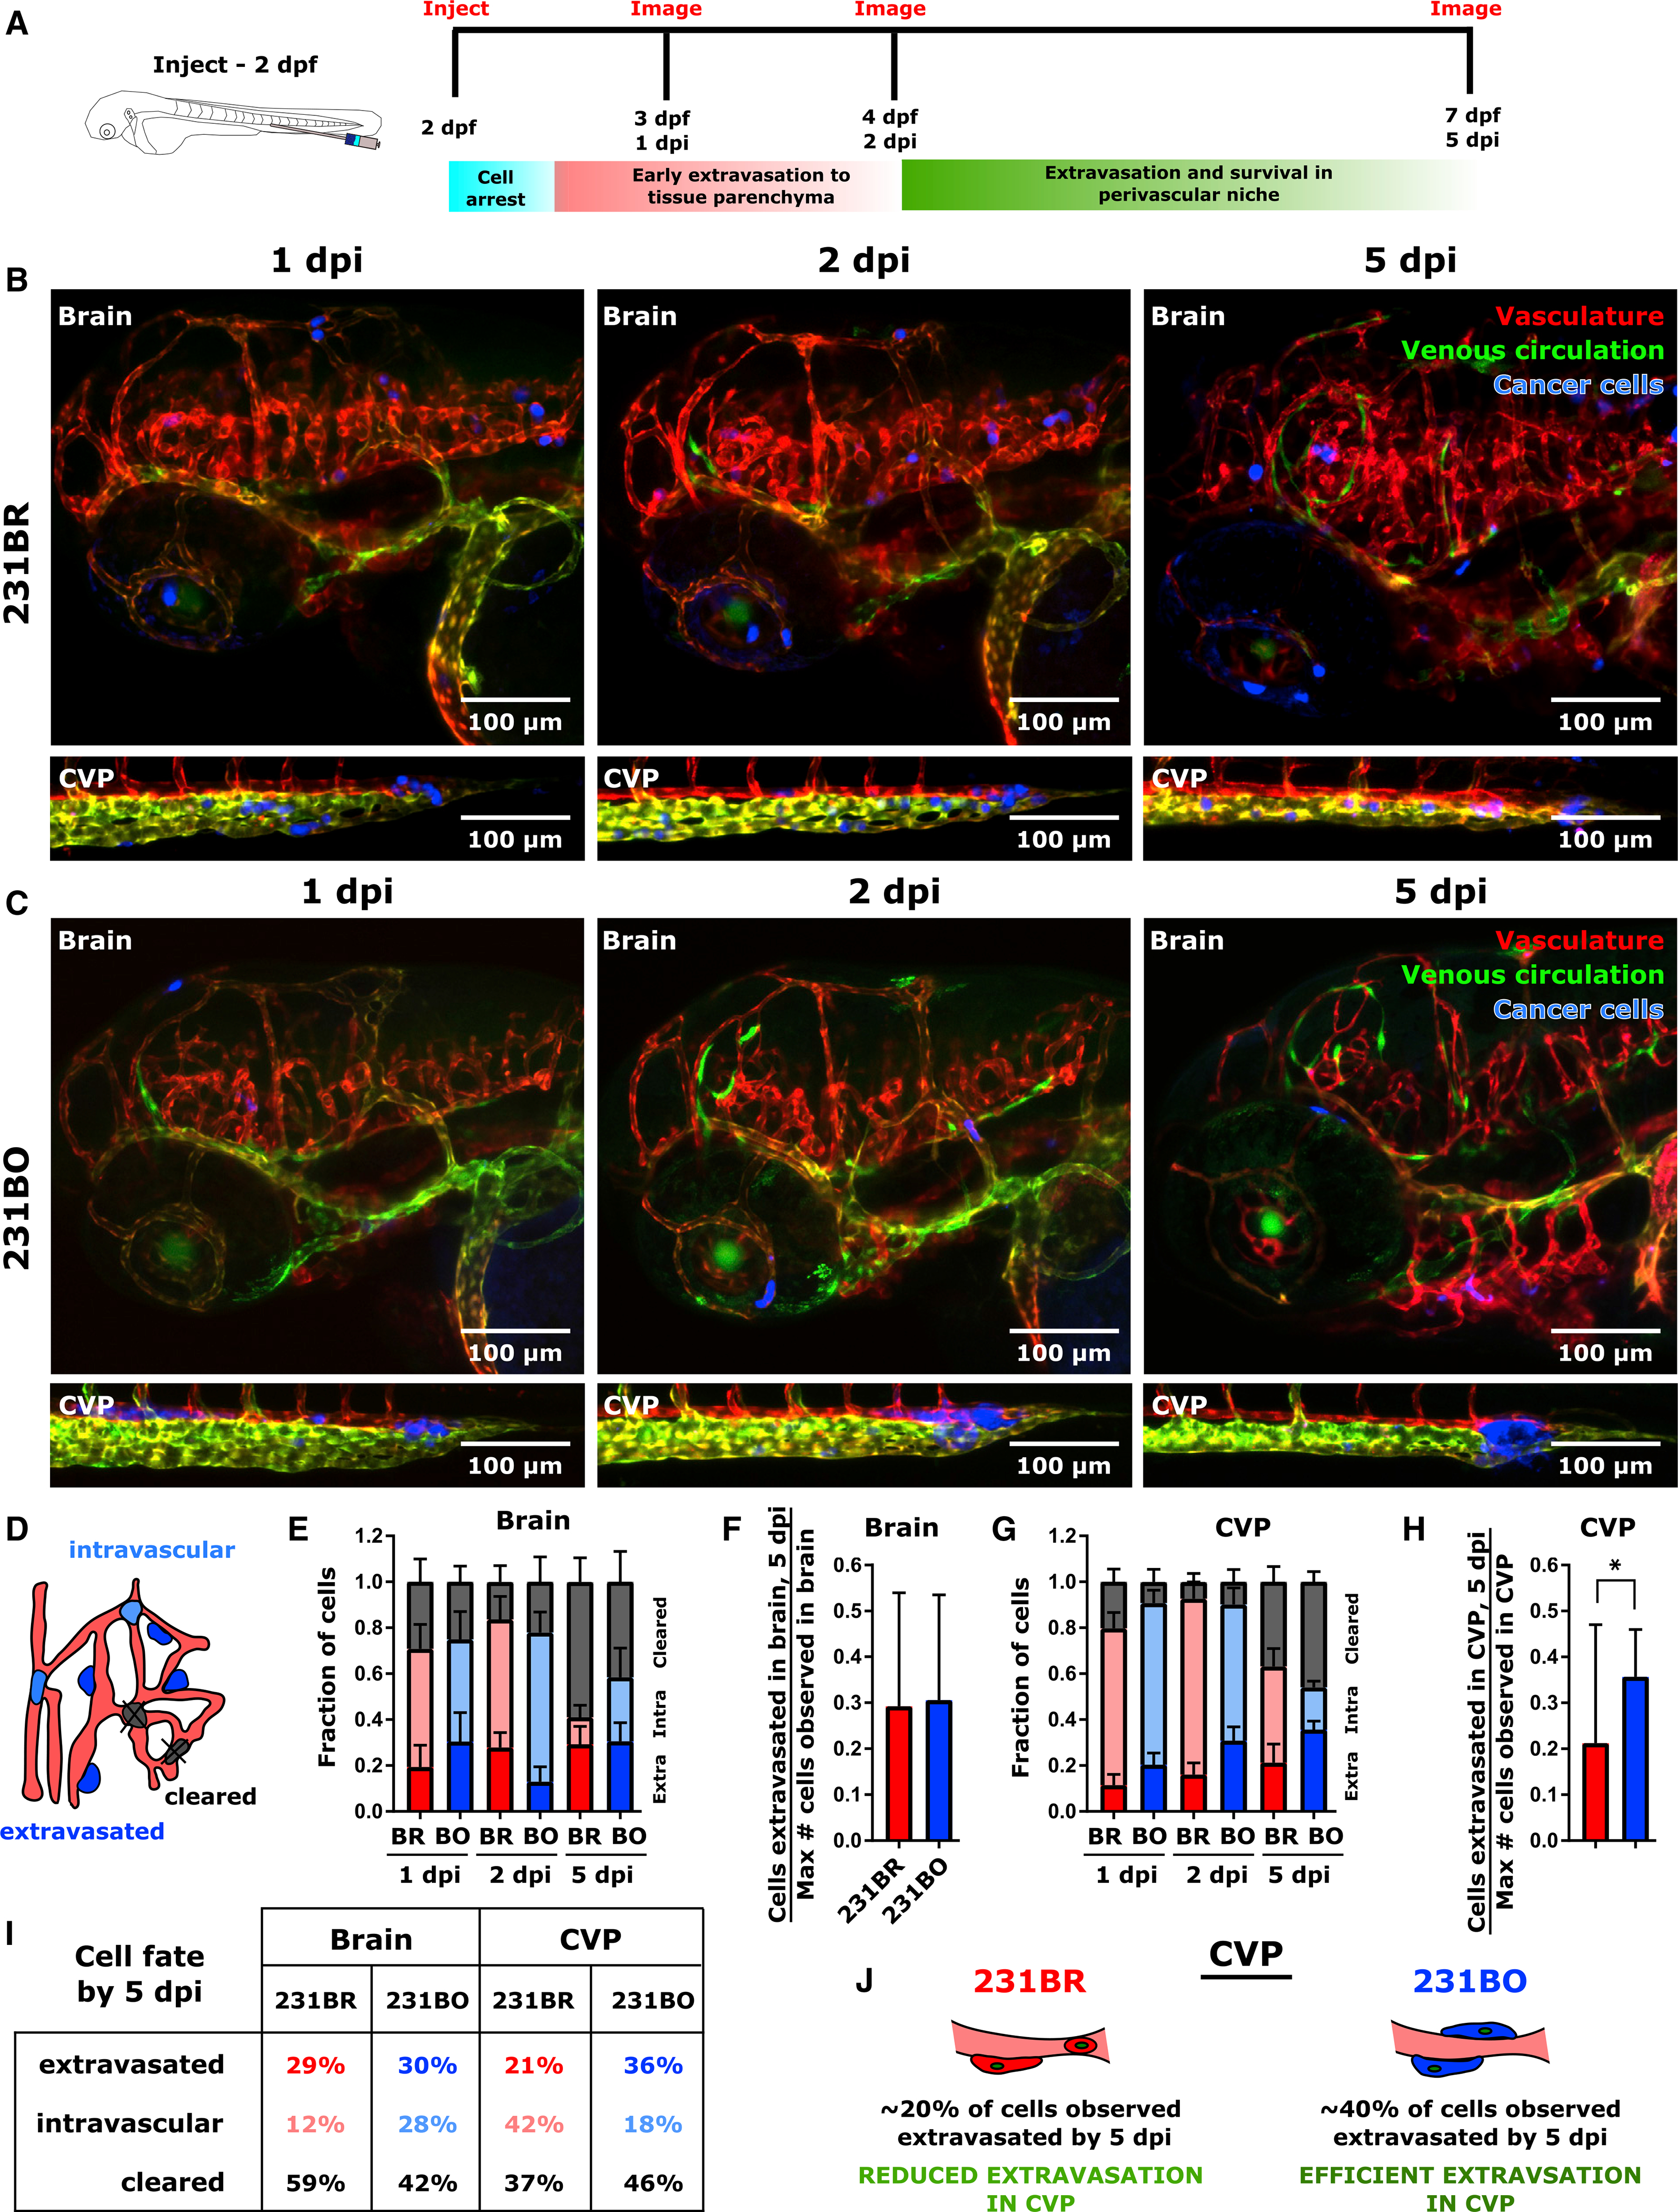
Figure 6. Differential Extravasation in the Caudal Vein Plexus Leads to Organ Selectivity Following Dissemination.

(A) Schematic of experiment. MDA-MB-231 brain-tropic (231BR) or bone-marrow-tropic (231BO) cells were injected to the circulation of Tg(flk:MCherry/MRC1a:EGFP) zebrafish at 2 days post-fertilization (dpf). The brain and caudal vein plexus (CVP) of injected larvae were imaged at 1, 2, and 5 days post-injection (dpi).
(B and C) Representative images of (B) larva injected with 231BR cells and (C) larva injected with 231BO cells at 1, 2, and 5 dpi. Images show the brain and CVP for 1 larva over time for each cell type. Images are average intensity projections from confocal Z stacks. The vasculature is displayed in red, the venous circulation in green, and injected cancer cells in blue. Scales are indicated.
(D) Schematic illustrating cell outcomes after arrival in the vasculature of a target organ. Cells can remain intravascular, extravasate to the parenchyma, or be cleared from the tissue.
(E) Average ± SEM fractions of 231BR and 231BO cells in the brain that are extravasated (bottom portion of bars), intravascular (middle portion of bars), or cleared (top portion of bars) at 1, 2, and 5 dpi.
(F) Average ± SD fraction of the maximum number of cells observed in the brain of a given larvae that were extravasated by 5 dpi. Average is calculated across larvae. Differences were not significant (p = 0.9098 by unpaired t test).
(G) Average ± SEM fractions of 231BR and 231BO cells in the CVP that are extravasated (bottom portion of bars), intravascular (middle portion of bars), or cleared (top portion of bars) at 1, 2, and 5 dpi.
(H) Average ± SD fraction of the maximum number of cells observed in the CVP of a given larvae that were extravasated by 5 dpi. Average is calculated across larvae. *p = 0.0124 by two-tailed Mann-Whitney test.
(I) Table detailing cell fate by 5 dpi in the brain and CVP. Values are averages obtained as in (E–H). In (E–I), values were calculated across N = 10 larvae for 231BR cells and N = 8 larvae for 231BO cells. Average fractions were calculated independently on each day.
(J) Schematic of cell extravasation outcomes in the CVP. Approximately 20% of 231BR cells observed in the CVP at 1 dpi had extravasated by 5 dpi. Extravasation of 231BO cells in the CVP was more efficient, with ~40% of cells observed at 1 dpi extravasating by 5 dpi. See also Figure S6.
