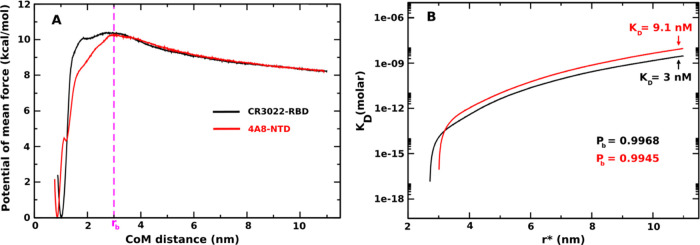
Figure 6.
(Left) One-dimensional potential of mean force (1D PMF) of CR3022–RBD (black curve) and 4A8–NTD (red curve). Results were obtained by applying the WHAM analysis for 750 ns REX-US simulations. (Right) KD curves as a function of r* corresponding to the change in the total free monomer concentration from eq 5. Pb and KD were determined at r* = 11 nm.

