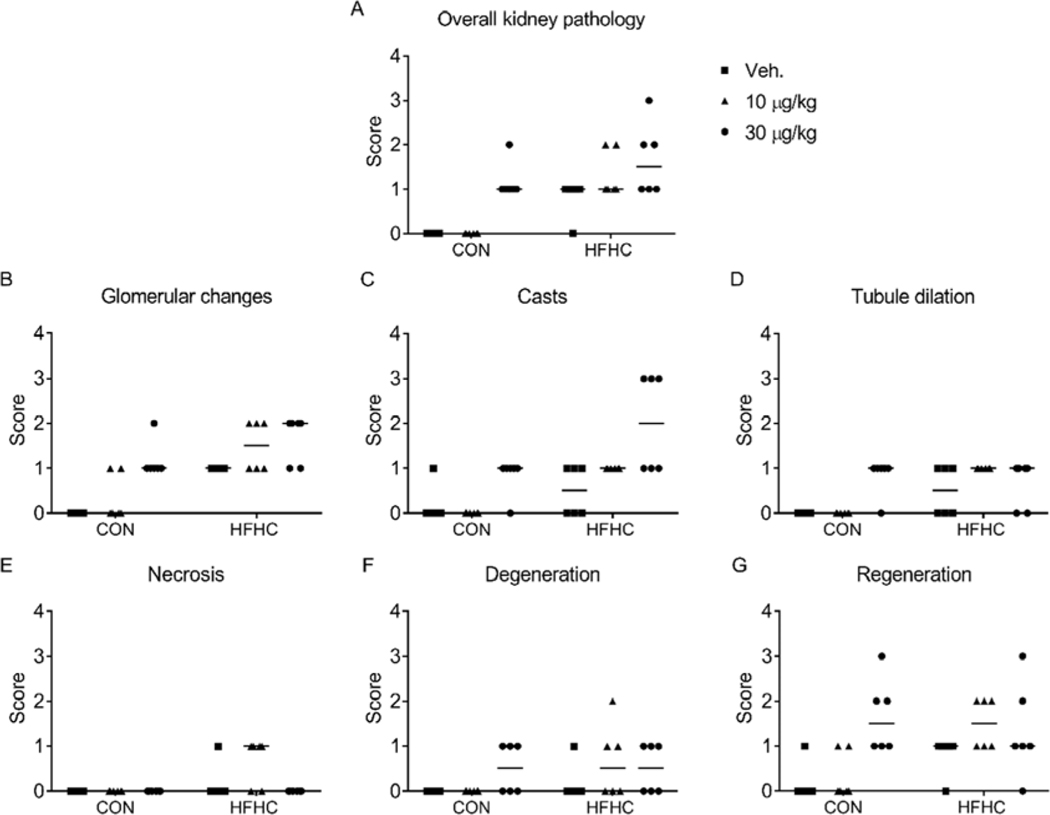
Figure 2:
Histology severity scores. (A) Overall kidney pathology, (B) Glomerular changes, (C) Casts, (D) Tubule dilation, (E) Necrosis, (F) Degeneration, and (G) Regeneration scores provided by the pathologist. Each point represents an individual animal in the group, n=6 per group. The horizontal lines represent the median for each group.

