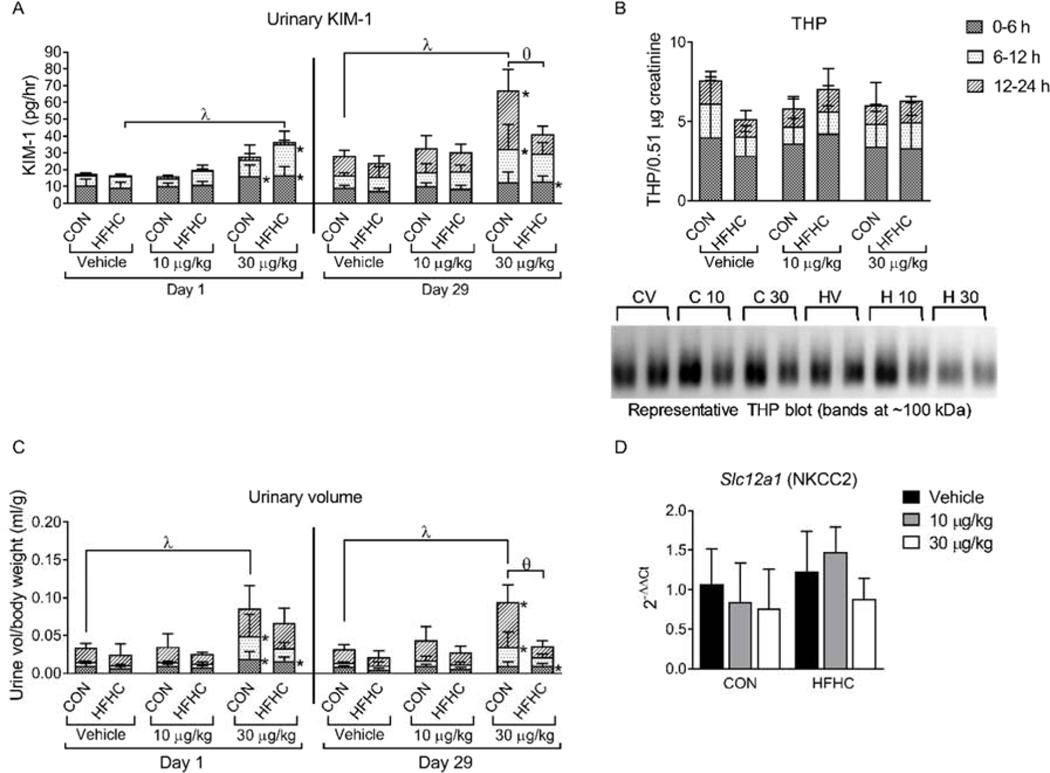
Figure 4:
KIM-1, THP and Polyuria. (A) (F) Urinary KIM-1 after a single dose (Day 1) and after the final dose of MCLR (Day 29) divided into the urine collection time points (0–6, 6–12, 12–24 h). (B) Day 29 urine THP divided into the urine collection time points (0–6, 6–12, 12–24 h), along with representative western blots.(C) Urine volumes after a single dose of MCLR (Day 1) and after the final dose of MCLR (Day 29) divided into the urine collection time points (0 to 6, 6 to 12, 12 to 24 h). (D) Slc12a1 (NKCC2) mRNA expression in the kidney. (C). Data represent mean ± SD, n = 6 per group. Two-way ANOVA Dunnett multiple comparison post-test represented by * indicate p-value <0.05, versus respective vehicle group for each collection period (0 to 6, 6 to 12, or 12 to 24 h). Two-way ANOVA Dunnett multiple comparison post-test represented by (λ) indicate p-value < 0.05 versus respective vehicle group for the complete 24-h period. Two-way ANOVA Sidak multiple comparison post-test represented with (ɵ) indicate p-value < 0.05 comparing control versus HFHC within each dose for the complete 24-h period.

