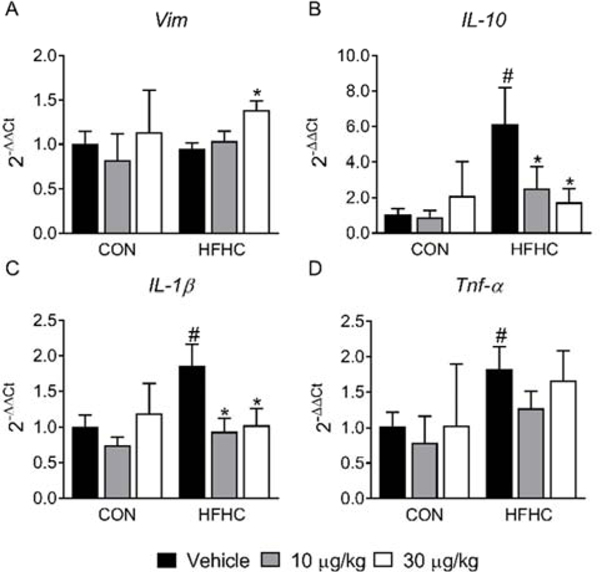
Figure 6:
Tubule regeneration and Inflammation. (A) Vim (Vimentin), (B) IL-10, (C) IL-1β, and (D) Tnf-α mRNA expression. Data represent mean ± SD. n = 6 per group. Two-way ANOVA Dunnett multiple comparison post-test represented with (*) indicate p-value < 0.05 versus respective vehicle group. Two-way ANOVA Sidak multiple comparison post-test represented with (#) indicate p-value < 0.05 within each dose group.

