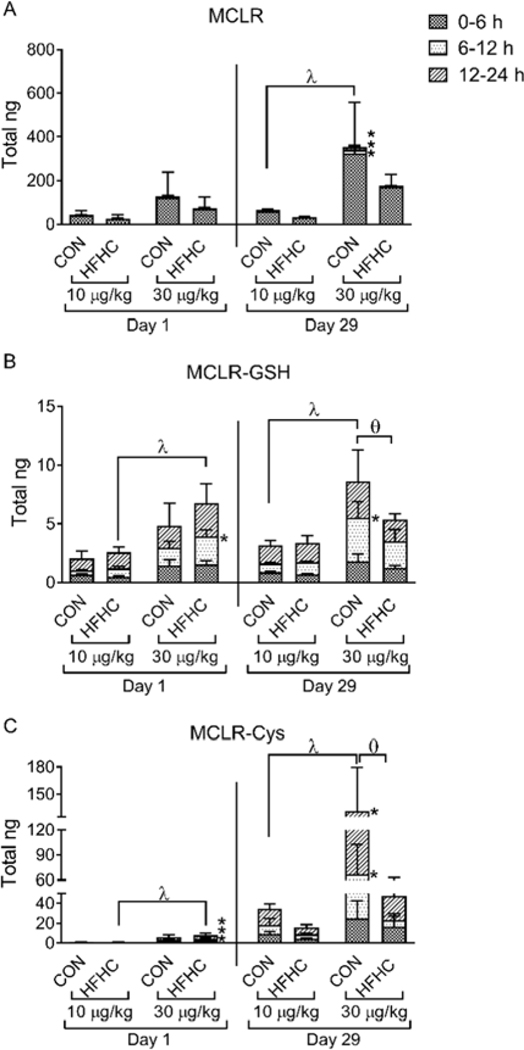
Figure 7:
MCLR metabolites. LC-MS/MS quantification of urinary elimination of (A) MCLR and MCLR metabolites (B) MCLR-GSH and (C) MCLR-Cys after a single dose (Day 1) and the final dose of MCLR (Day 29) divided into the urine collection time points (0–6, 6–12, 12–24 h). Data represent mean ± SD, n = 6 per group. Two-way ANOVA Dunnett multiple comparison post-test represented by * indicate p-value <0.05, versus respective vehicle group for each collection period (0–6, 6–12, or 12–24 h). Two-way ANOVA Dunnett multiple comparison post-test represented by (λ) indicate p-value < 0.05 versus respective vehicle group for the complete 24-h period. Two-way ANOVA Sidak multiple comparison post-test represented with (ɵ) indicate p-value < 0.05 comparing control versus HFHC within each dose for the complete 24-h period.

