
Figure 6.
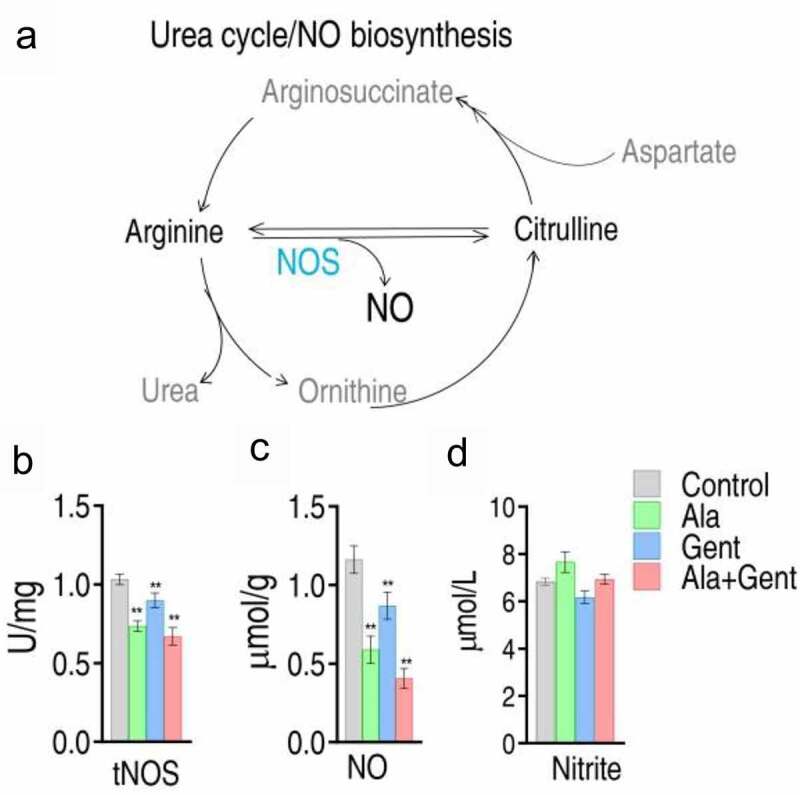
NO generation and level mediated by Gent, Ala, and both. A. Metabolic diagram of NO generation. B. Activity of NO synthase (NOS) in V. alginolyticus ATCC33787 in response to Ala, Gent, and both. C. NO level in V. alginolyticus ATCC33787 in response to Ala, Gent, and both. D, Nitrite in V. alginolyticus ATCC33787 in response to Ala, Gent, and both. Results (b and c) are displayed as mean ± SEM, and significant differences are identified (*p < 0.05, **p < 0.01) as determined by two-tailed Student’s t test