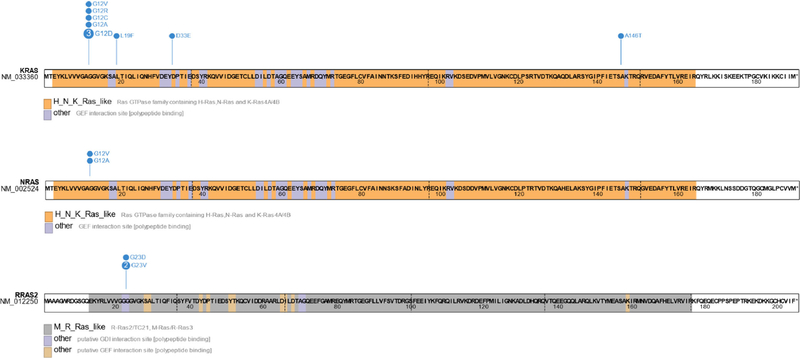
Figure 3.
Spectrum of somatic mutations in KRAS, NRAS, and RRAS2. Missense mutations are shown in the lollipop plots in blue. The number within each circle corresponds to the number of times that mutation was identified. Selected protein domains are indicated by the colors shown below the diagrams. The amino acid sequences and positions are superimposed.

