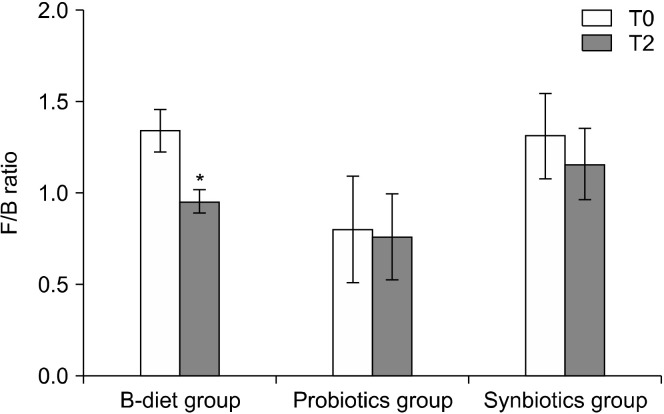
Fig. 3.
Effect of each diet on changes in the Firmicutes-to-Bacteroidetes (F/B) ratio. T0, baseline value; T2, after 2 weeks of intervention. Values are expressed as the mean±SEM. B-diet group, whole grains and vegetable-enriched diet; probiotics group, probiotics capsule containing Lactobacillus plantarum PMO 08; synbiotics group, whole grains and vegetable-enriched diet combined with L. plantarum PMO 08. *P<0.05 compared with baseline (T0), calculated using paired t-tests.

