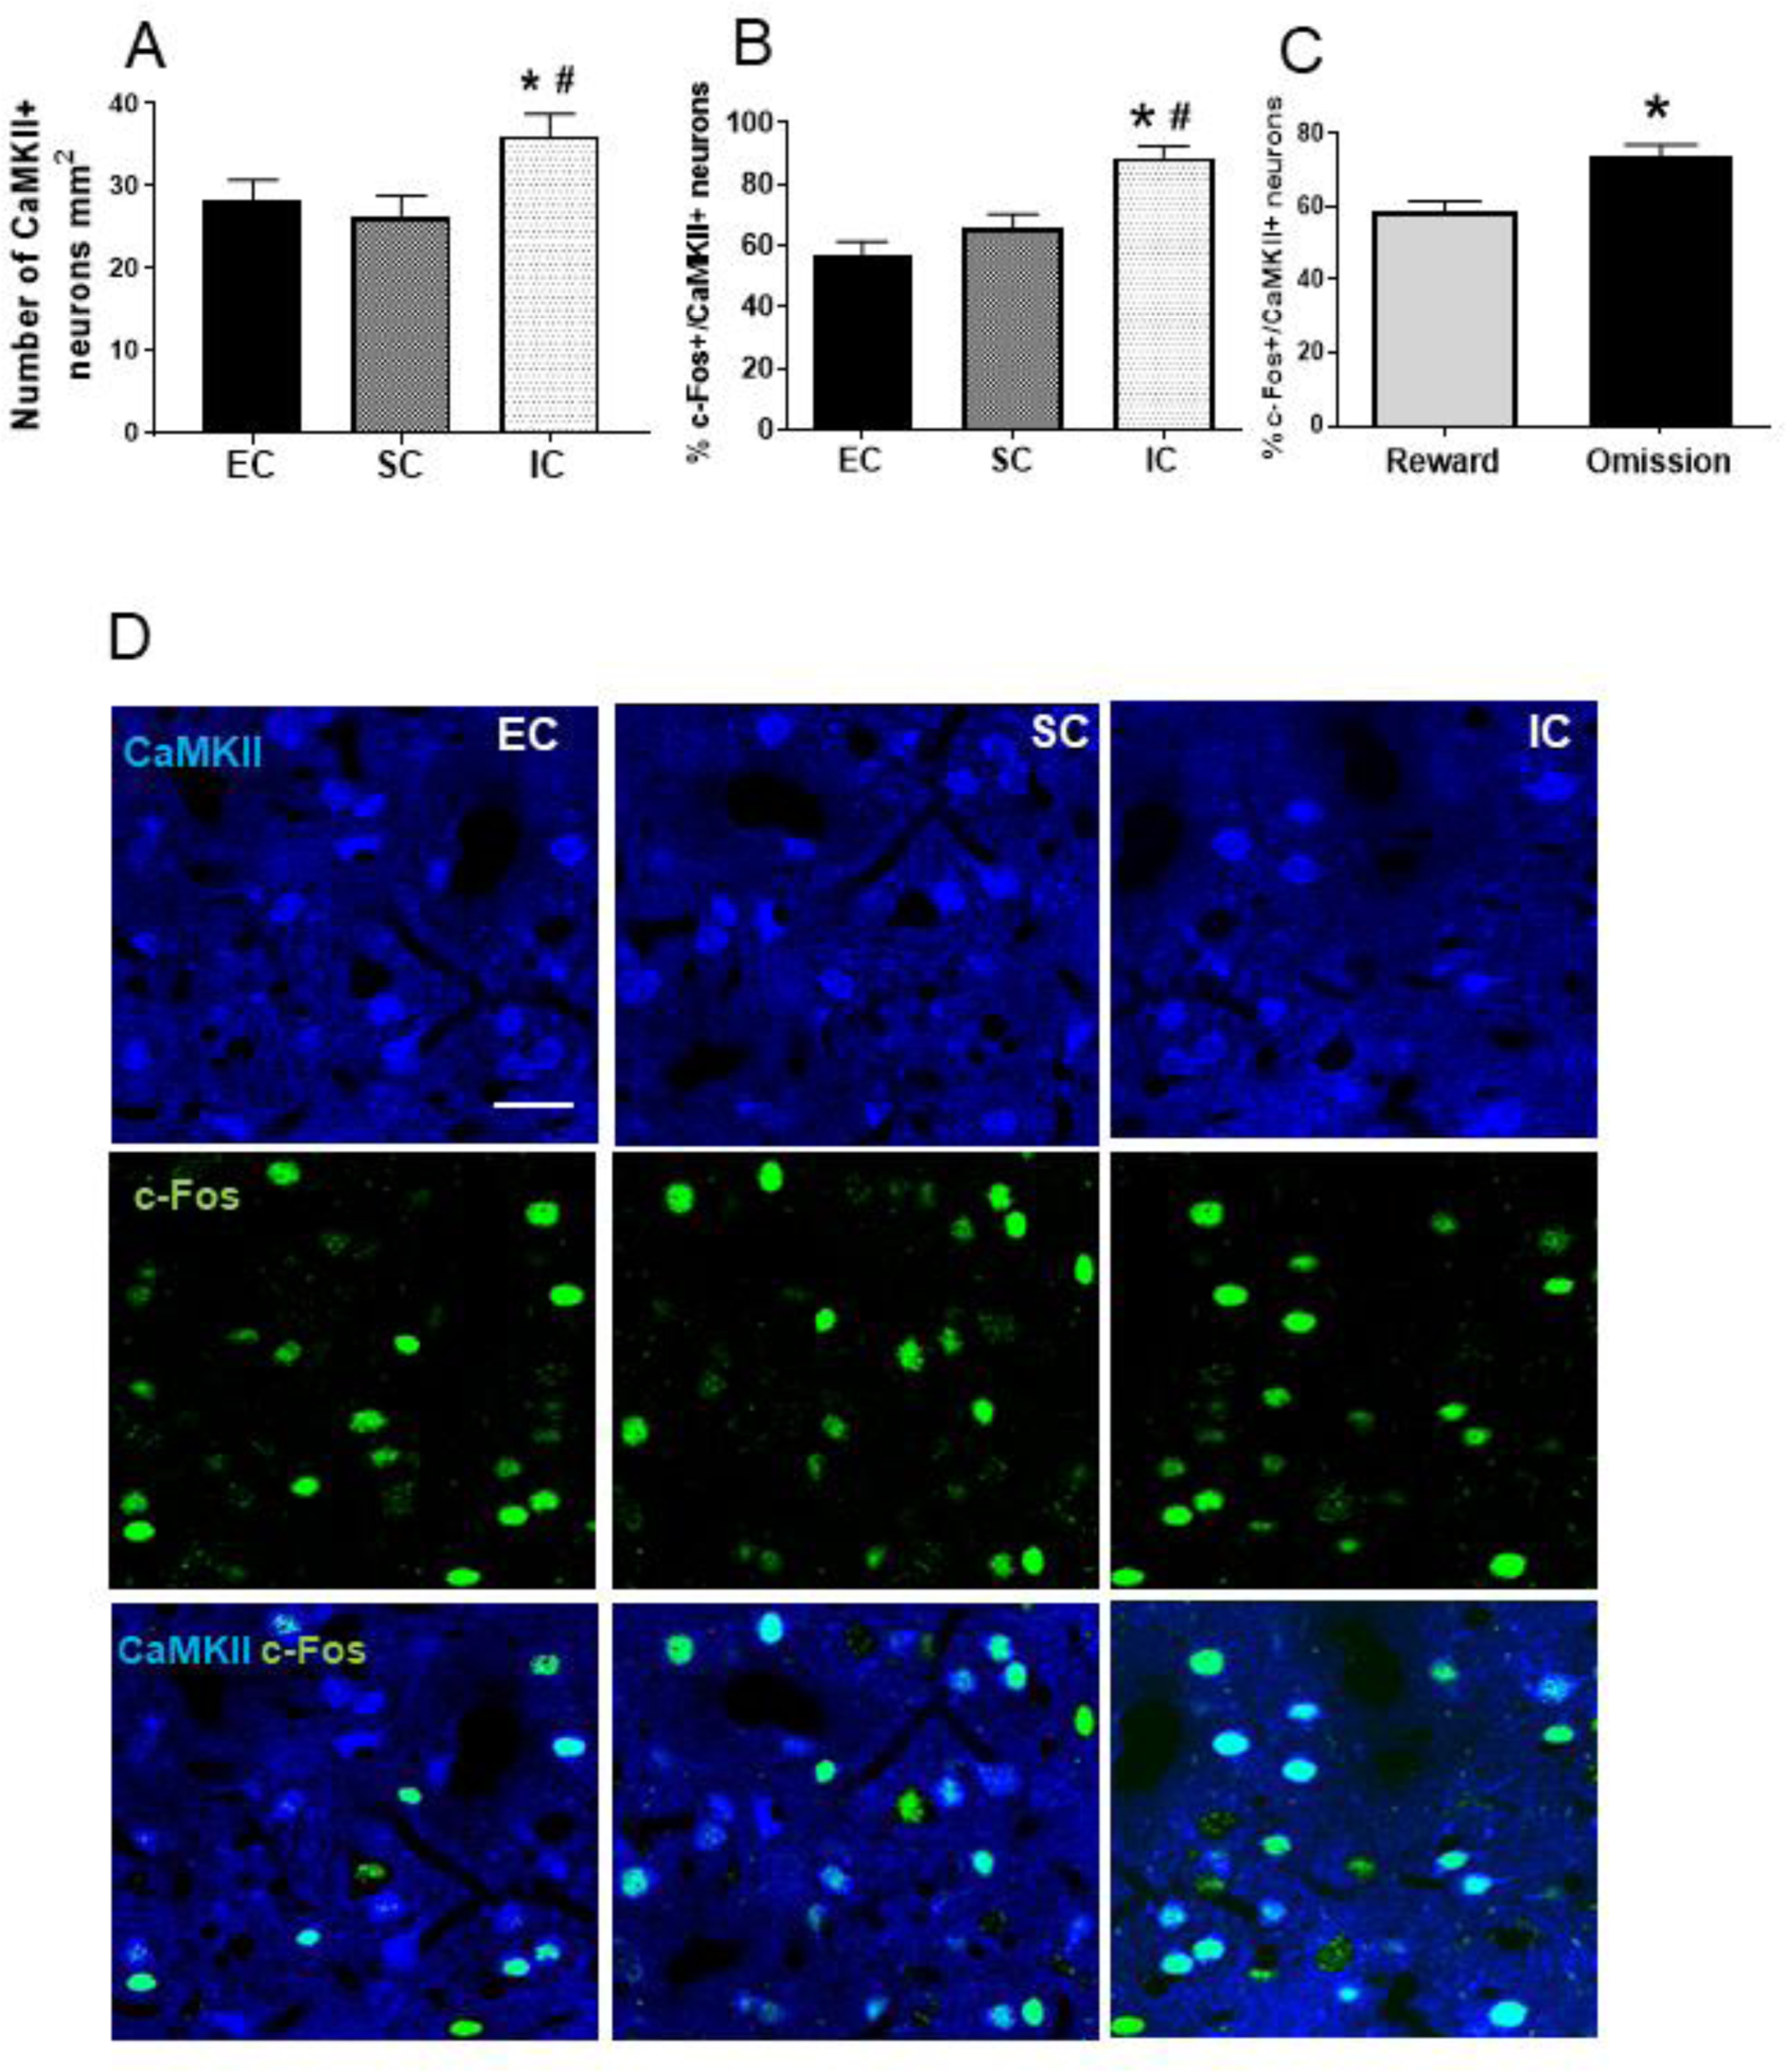
Figure 3.

A. Mean (±SEM) number of CaMKII+ neurons in EC, SC, and IC rats. *Represents a significant difference from EC. #Represents a significant difference from SC. B. Mean (±SEM) percent of CaMKII+ neurons co-expressing c-Fos in EC, SC, and IC rats. *Represents a significant difference from EC. #Represents a significant difference from SC. C. Mean (±SEM) percent of CaMKII+ neurons co-expressing c-Fos in IC rats after a baseline reward session or a session consisting of 2 omission trials. *Represents a significant difference from reward trials. D. Photos are representative confocal images of CaMKII+ neurons co-labelled with c-Fos in EC, SC and IC rats.
