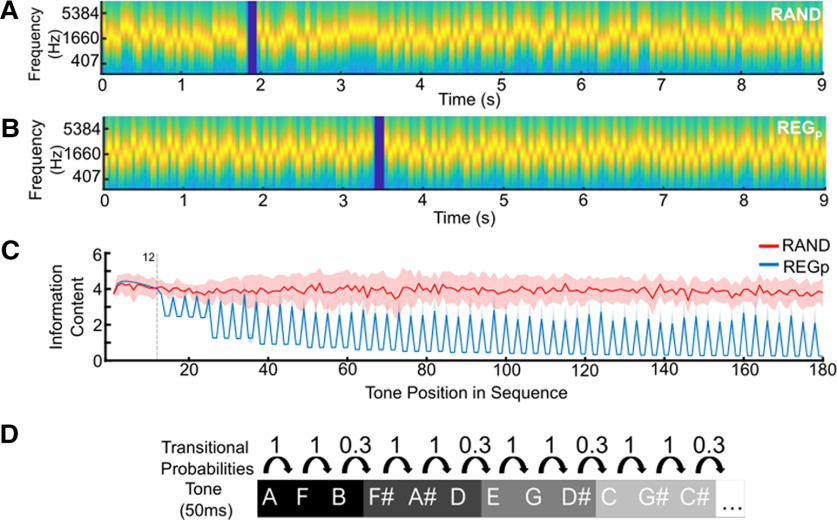
Figure 2.
Stimuli used in experiment 2. Stimuli were sequences of concatenated tone pips (50 ms) with frequencies consisting of 12 different values that correspond to the musical notes shown in D. A, Spectrogram of RAND sequences where the tones do not follow a predictable pattern. A subset of trials was target trials containing a gap generated by the removal of three tones, the gap is indicated by a dark blue band in the spectrogram of A, B. B, Spectrogram of the “regular” (REGp) condition that followed the probabilistic structure shown in D, top row; tones were arranged into four three-item tone “words,” the four words are shown in different shades of gray. The tones within a word always occurred together giving them a TP of 1. Each word could transition to any of the other words, giving tones at word boundaries a TP of ∼0.3. Therefore, these sequences do not have a regular structure in the same way as experiment 1, compare with Figure 1A. C, Ideal observer model response to RAND (red) and REGp (blue) signals shows the IC [negative log probability (-log P); the higher the IC value the more unexpected the tone] of each tone pip (averaged over 24 different sequences). This modeling confirms that while IC remains consistently high for unpredictable sequences (RAND, red), for REGp (blue) it begins to drop on average after 12 tones. Evidence for the predictable structure then continues to accumulate throughout the sequences as indicated by the gradual separation between the REGp and RAND ICs. Shading indicates ±1 SEM (D, bottom row). The random sequences presented the same tones as the regular sequences but in a random order.

