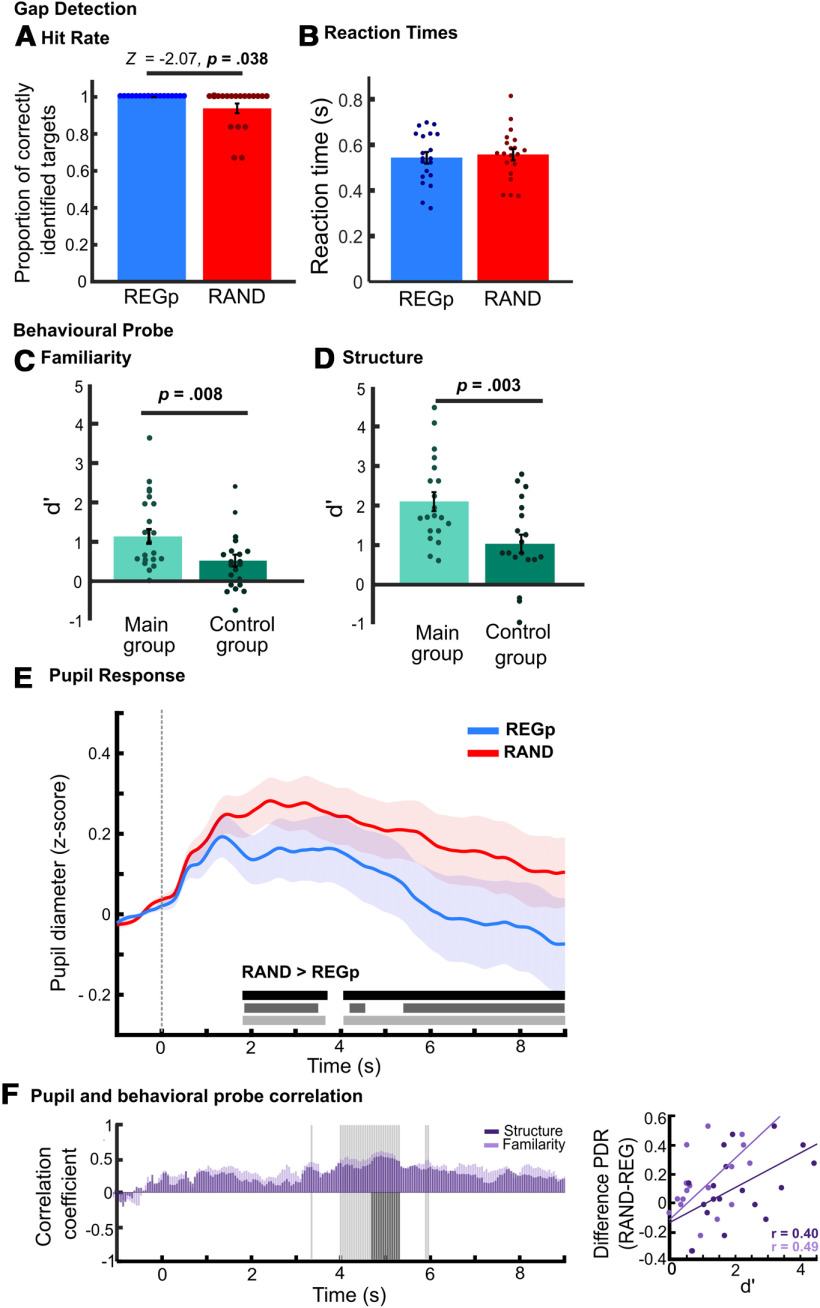
Figure 4.
Experiment 2, probabilistic regularities modulate pupil size. A, HR analysis showed more gaps were detected in REGp (blue) than RAND (red) sequences. There were no false alarms (data not shown). B, RTs for gap detection showed no significant differences. Following the main experiment, two behavioral probes were separately conducted, in one, listeners were asked to judge whether sequences were familiar (C), and in the other whether they contained a structure (D). D prime (d') is plotted for the main group (light green) and a control group who had not conducted the main pupillometry experiment (dark green). Error bars show ±1 SEM, circles show individual subjects. E, Average normalized pupil diameter over time, baseline corrected (−1- to 0-s preonset). The shaded area shows ±1 SEM. The horizontal bars show time intervals during which significant differences (bootstrap statistics) were observed. The black bar shows the original results, the dark gray bar shows significant time intervals when the five participants with below ceiling performance were removed from the analysis (see Materials and Methods), the light gray bar shows the significant time intervals after adjusting for the subject-wise difference (RAND-REGp) in RT. In all cases, the difference between RAND and REG persists suggesting that the main effects are not driven by effort toward the gap detection task (F) Spearman correlation between the difference in pupil diameter (RAND – REGp) and d' from the familiarity probe (light purple) and structure probe (dark purple) conducted sample-by-sample (20 Hz) over the entire trial duration. Each purple bar shows the Spearman correlation coefficients at each time point for the two probe tasks. Gray shaded areas indicate time intervals where a significant correlation (p < 0.05; FWE uncorrected) was observed, light gray corresponds to the correlation with the familiarity probe, significant periods for the structure probe are in dark gray and plotted only on the lower part of the y-axis. For the gray bars, the relationship to the y-axis is for visualization purposes and not meaningful. The plot on the right illustrates the link between pupil size and subsequently assessed sensitivity to regularity by displaying the correlation (Spearman r) between pupil size differences (averaged across 4–6 s) and individual familiarity (light purple) and structure judgments (dark purple).

