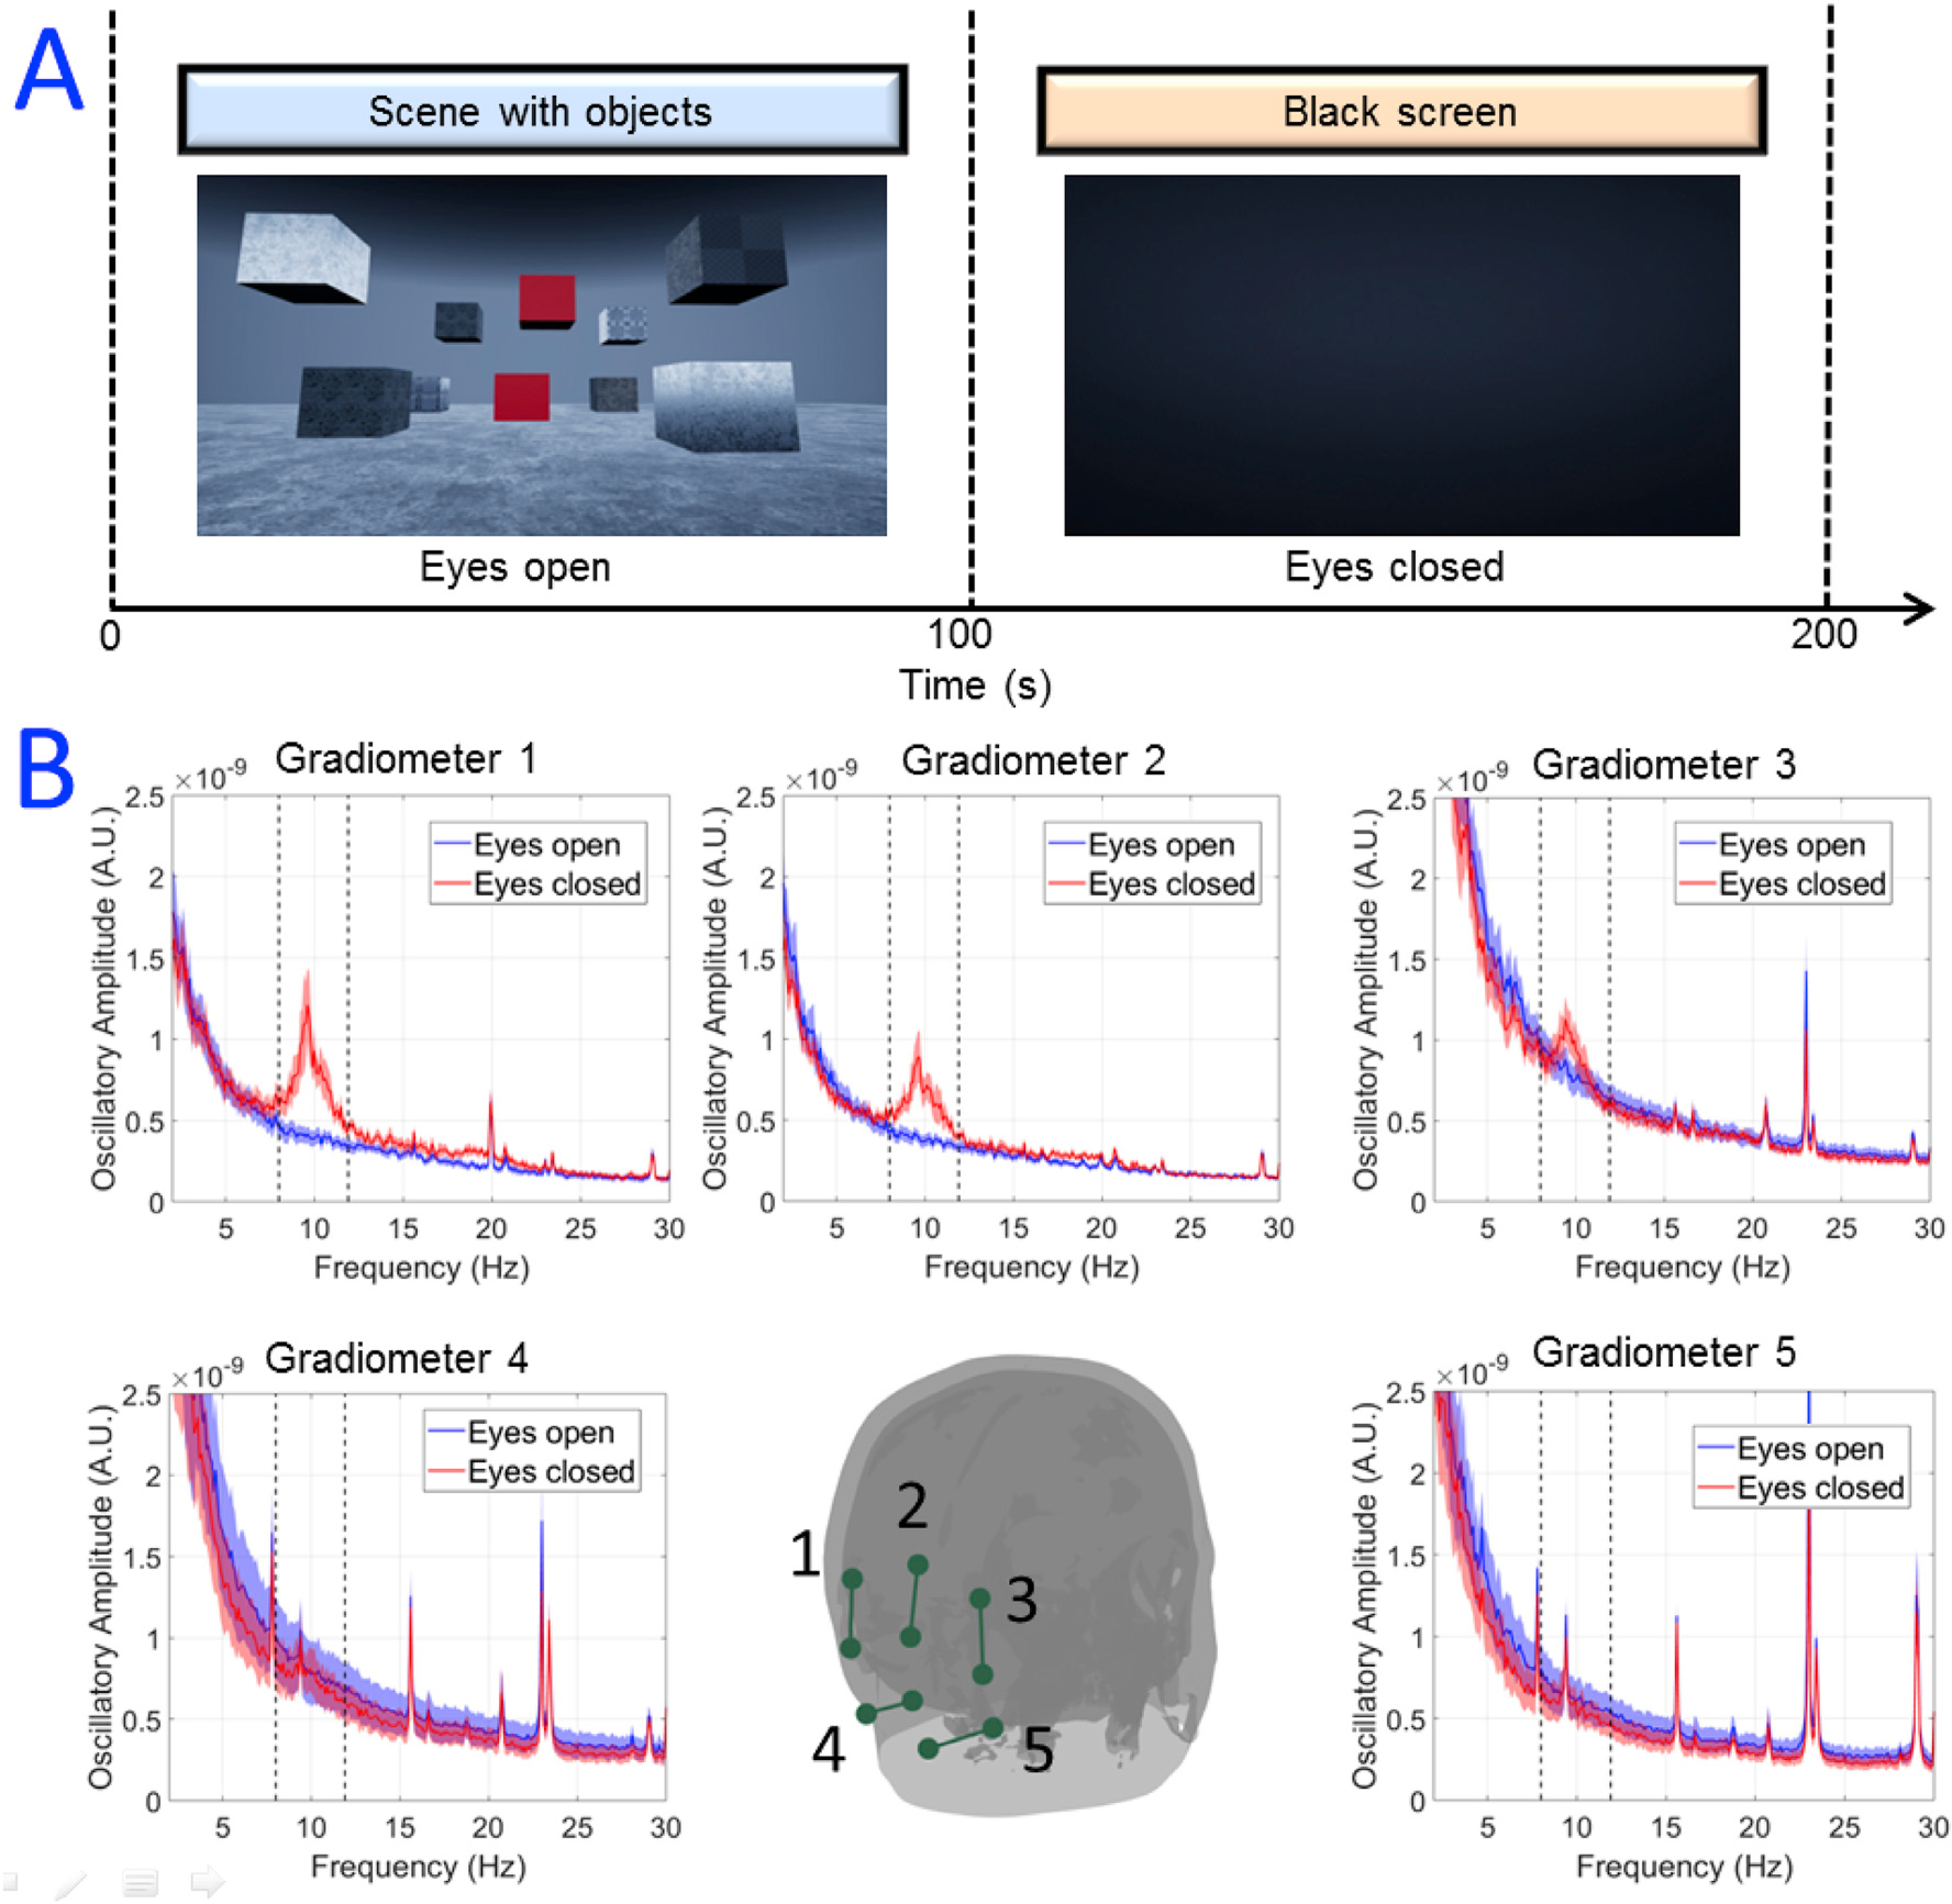
Fig. 2. Modulation of alpha oscillations.

(A) Schematic diagram showing the paradigm in which a static 3D visual scene was presented to the participants for 100 s whilst they had their eyes open, and then faded to black when the participants closed their eyes for a further 100 s. (B) OPM measurements - the coloured dots show locations of the OPM sensors on the scalp. The 10 magnetometers were formed into 5 gradiometer channels marked by the dark green lines. The inset graphs show power spectra of the measured data, averaged over 10 participants. Red shows data with eyes closed and blue shows data with eyes open. The shaded area shows the standard deviation over participants. Note the significant increase in alpha oscillations when the eyes were closed, in gradiometer channels sensitive to visual cortex.
