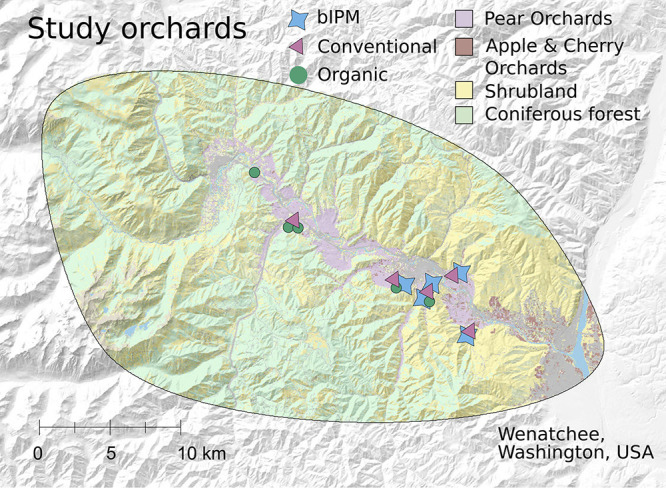
FIG 5.

Geographic extent of survey, where 15 pear orchards in central Washington across variable landscape contexts were sampled during peak bloom. The study site map was created with ArcGIS (v10.8; ESRI Inc., Redlands, CA, USA) and Inkscape (v1.0.2; https://inkscape.org), with elevation and land cover shading based on the National Elevation Dataset (USDA NRCS) and Cropland Data Layer product (USDA NASS [https://www.nass.usda.gov/Research_and_Science/Cropland/SARS1a.php]), respectively.
