
Figure 3:
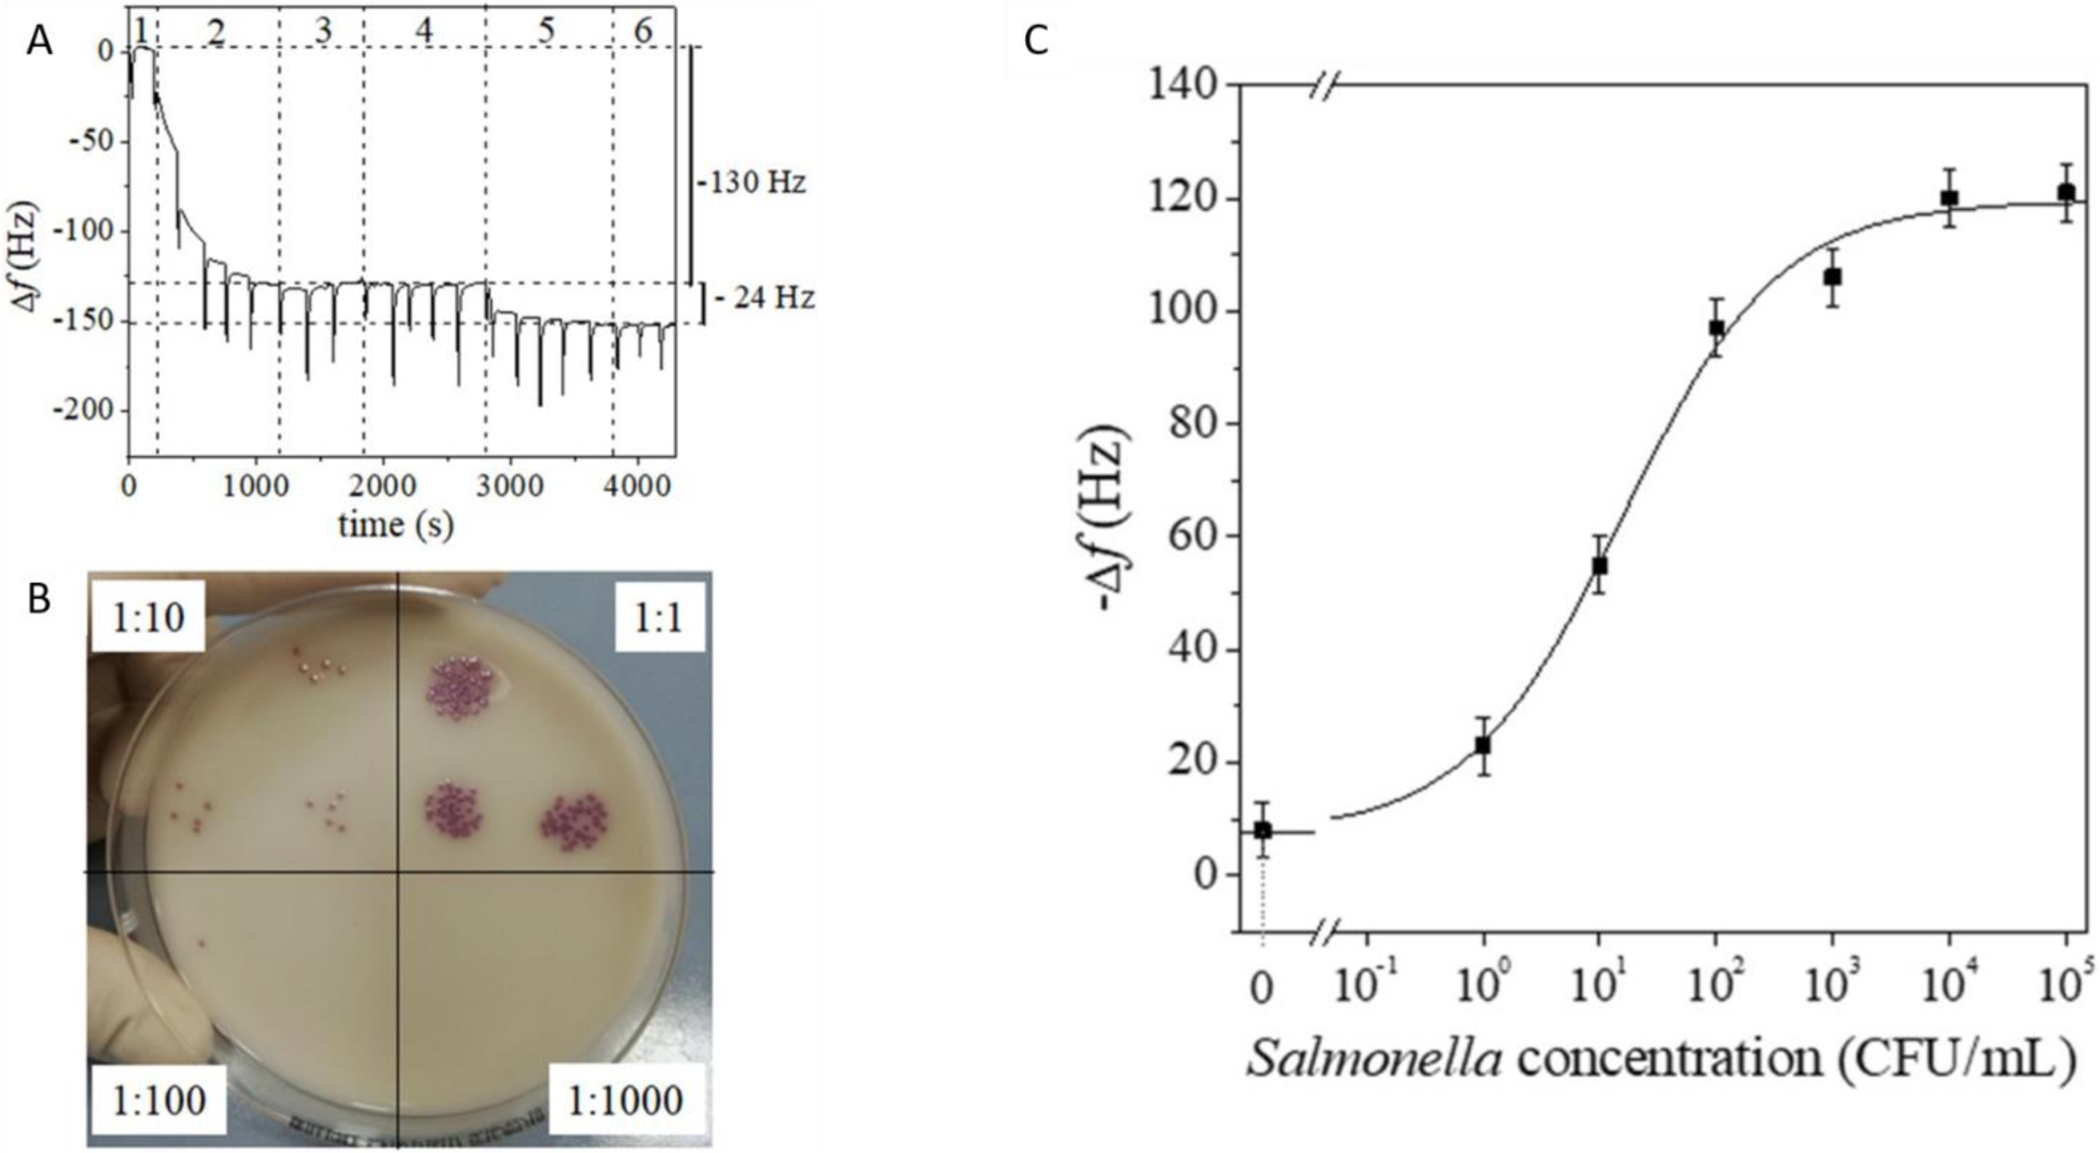
Taken from Fulgione et. al. A.) QCM Sensorgram after pre-enrichment. B.) Spot dilutions on Salmonella chromogenic agar base before pre-enrichment. Dilution factors are shown. C.) QCM Sensor dose-response curve referring to chicken meat contaminated with differing concentrations of S. typhimurium.