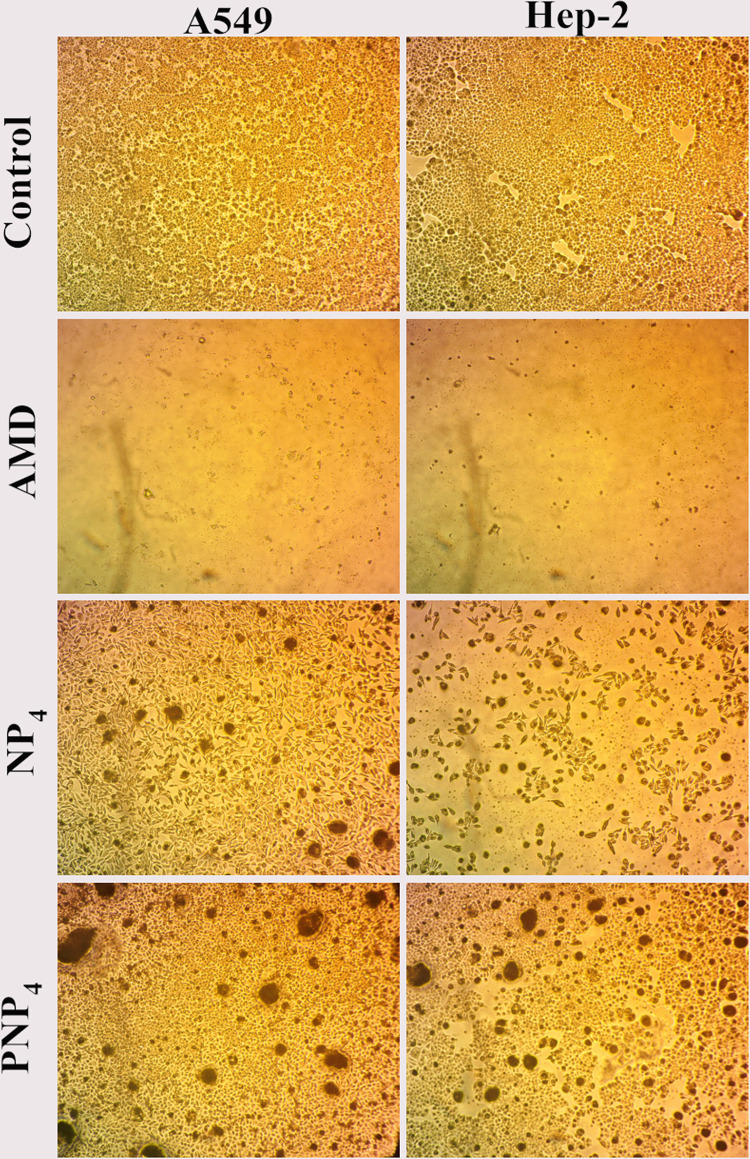
Figure 7.
The morphological changes of A549, and Hep-2 after treatment with pure AMD, NP4, and PNP4 for 72 h.
Notes: Control cells show normal morphology with typical viability, the AMD-treated cells are almost dead with an obvious decline in number, the NP4-treated cells show a reduction in volume and cellular shrinkage, PNP4 caused fewer morphological changes compared to NP4 with some apoptotic characteristics and losing contact between neighboring cells. 100×.

